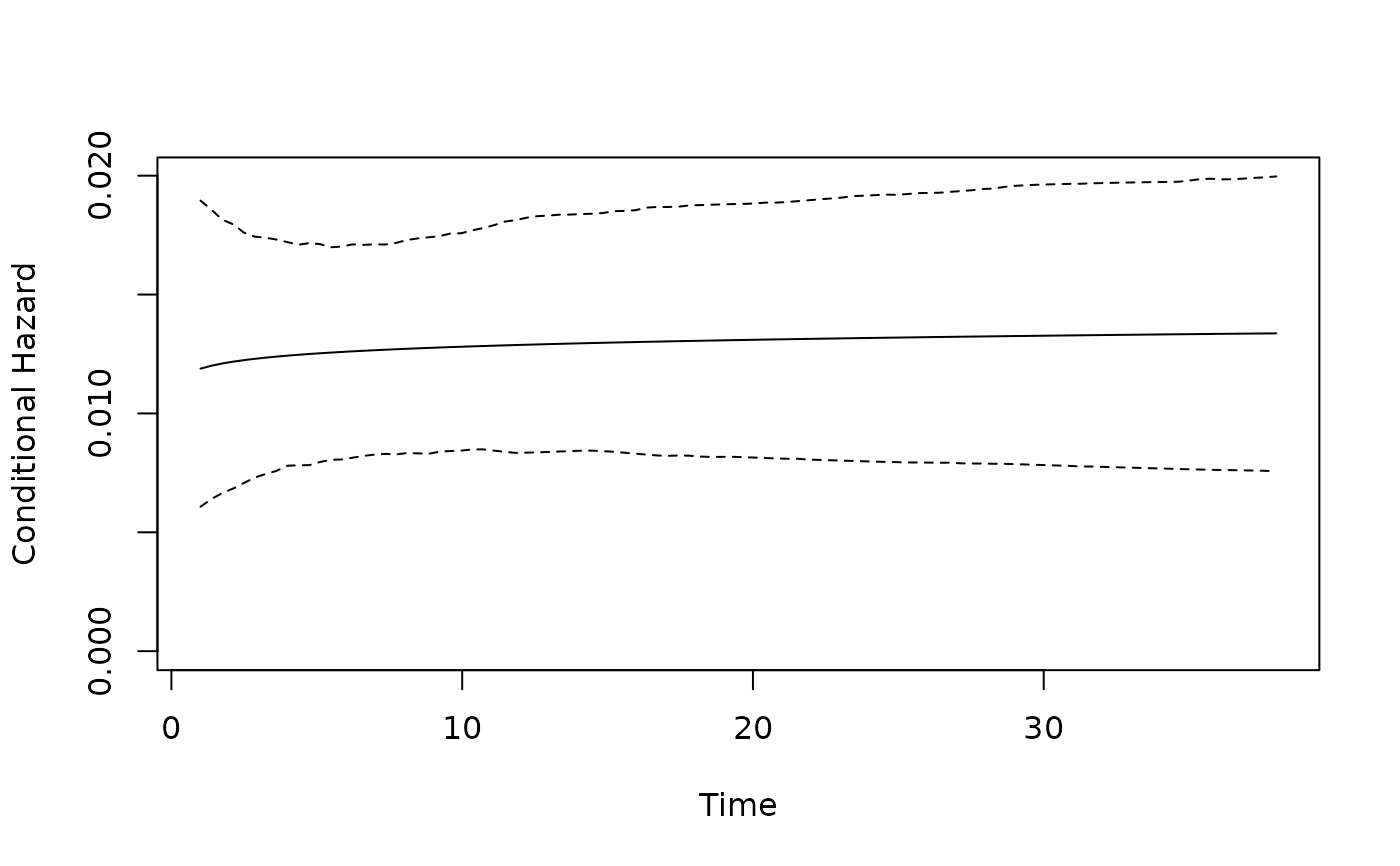
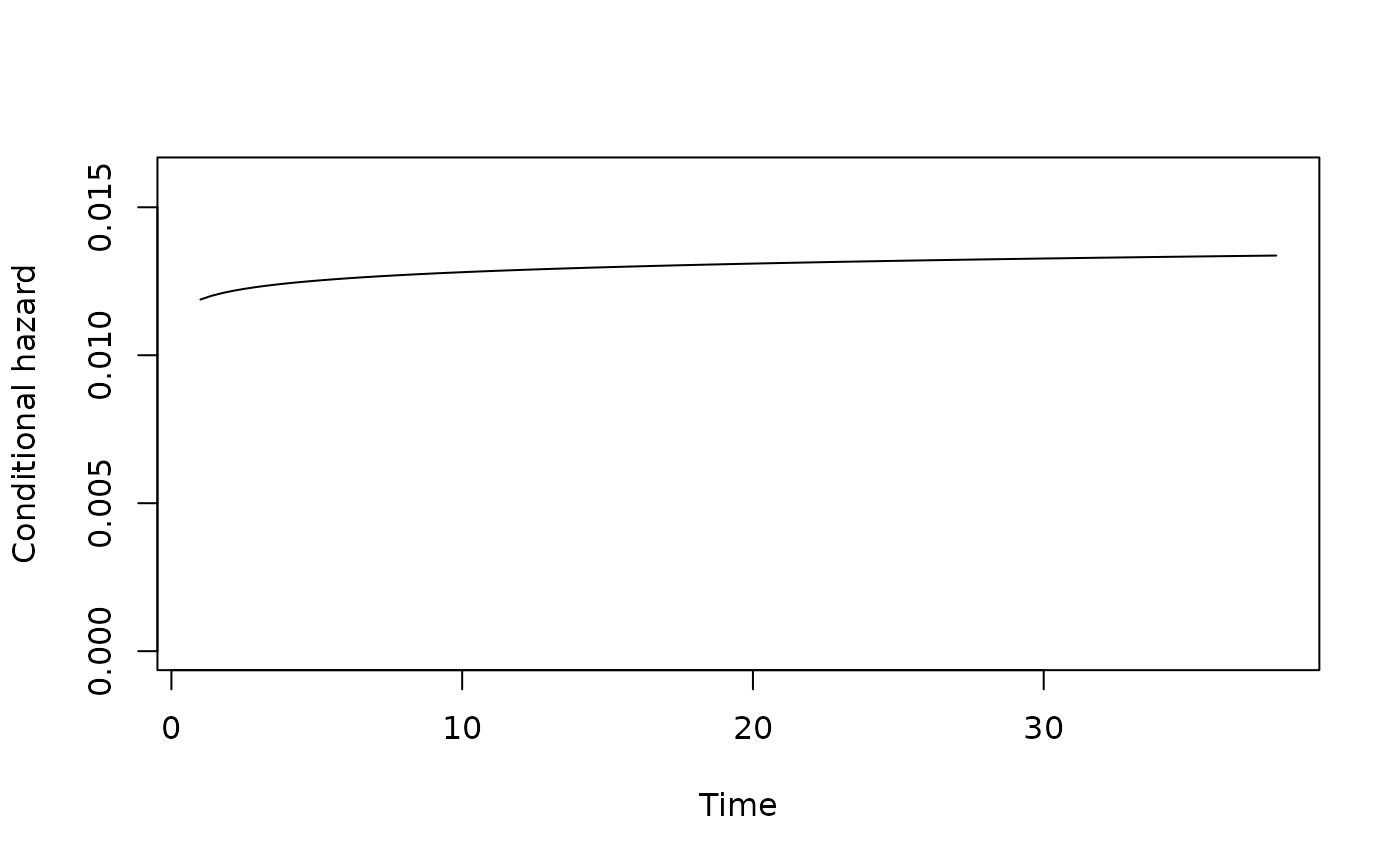
plot_hazard plots the shape of estimated hazard function in respect
to duration, given a set of values for the duration and risk equations
covariates. Confidence intervals are provided through simulation.
Arguments
- x
An object of class
spdur- t
Time values at which to evaluate hazard function, e.g.
c(1:50). Defaults to 1 through 1.2 * maximum duration value in data.- ci
Compute simulation-based confidence interval?
- n
Number of simulations to use for CI, defaults to 1,000.
- xvals
A vector of values for the duration equation variables, in the same order as the duration equation in
x. Defaults to means.- zvals
A vector of values for the risk equation variables, in the same order as the risk equation in
x. Defaults to means.- ...
Additional parameters passed to
plot.
Examples
# Get model estimates
data(model.coups)

# Plot
plot_hazard(model.coups, ci = FALSE)

plot_hazard(model.coups, ci = TRUE)