For correctly plotting country-time period spells
id_date_sequence(x, pd = NULL)Examples
library("ggplot2")
d1 <- as.Date("2018-01-01")
d2 <- as.Date("2025-01-01")
seq1 <- seq(d1, d2, by = "year")
data.frame(seq1, id=id_date_sequence(seq1, "year"))
#> seq1 id
#> 1 2018-01-01 1
#> 2 2019-01-01 1
#> 3 2020-01-01 1
#> 4 2021-01-01 1
#> 5 2022-01-01 1
#> 6 2023-01-01 1
#> 7 2024-01-01 1
#> 8 2025-01-01 1
# With a gap, should be two ids
df <- data.frame(date = seq1[-4], id=id_date_sequence(seq1[-4], "year"), cowcode = 999)
df
#> date id cowcode
#> 1 2018-01-01 1 999
#> 2 2019-01-01 1 999
#> 3 2020-01-01 1 999
#> 4 2022-01-01 2 999
#> 5 2023-01-01 2 999
#> 6 2024-01-01 2 999
#> 7 2025-01-01 2 999
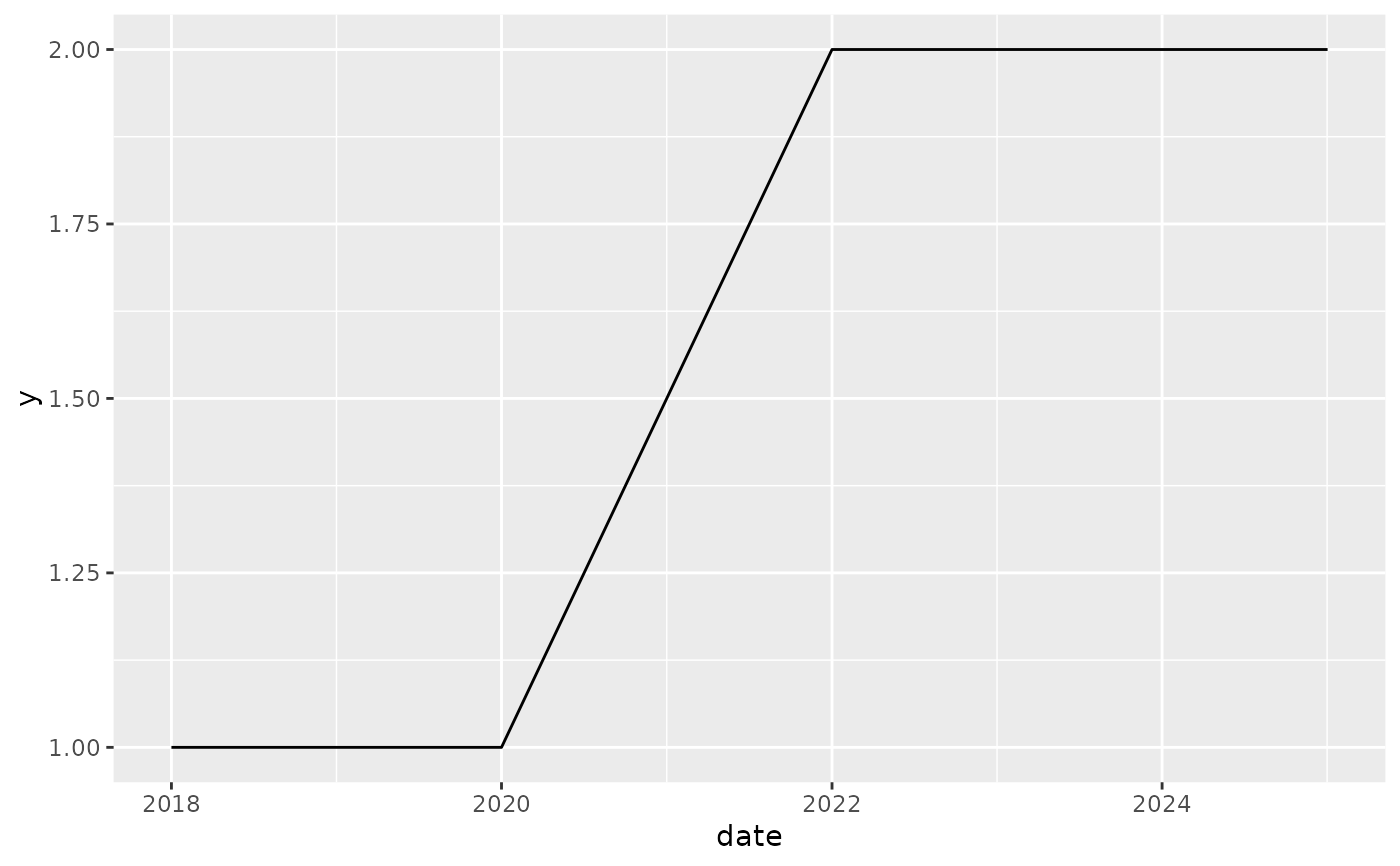
# The point is to plot countries with interrupted independence correctly:
df$y <- c(rep(1, 3), rep(2, 4))
df$id <- paste0(df$cowcode, df$id)
df
#> date id cowcode y
#> 1 2018-01-01 9991 999 1
#> 2 2019-01-01 9991 999 1
#> 3 2020-01-01 9991 999 1
#> 4 2022-01-01 9992 999 2
#> 5 2023-01-01 9992 999 2
#> 6 2024-01-01 9992 999 2
#> 7 2025-01-01 9992 999 2
ggplot(df, aes(x = date, y = y, group = cowcode)) + geom_line()
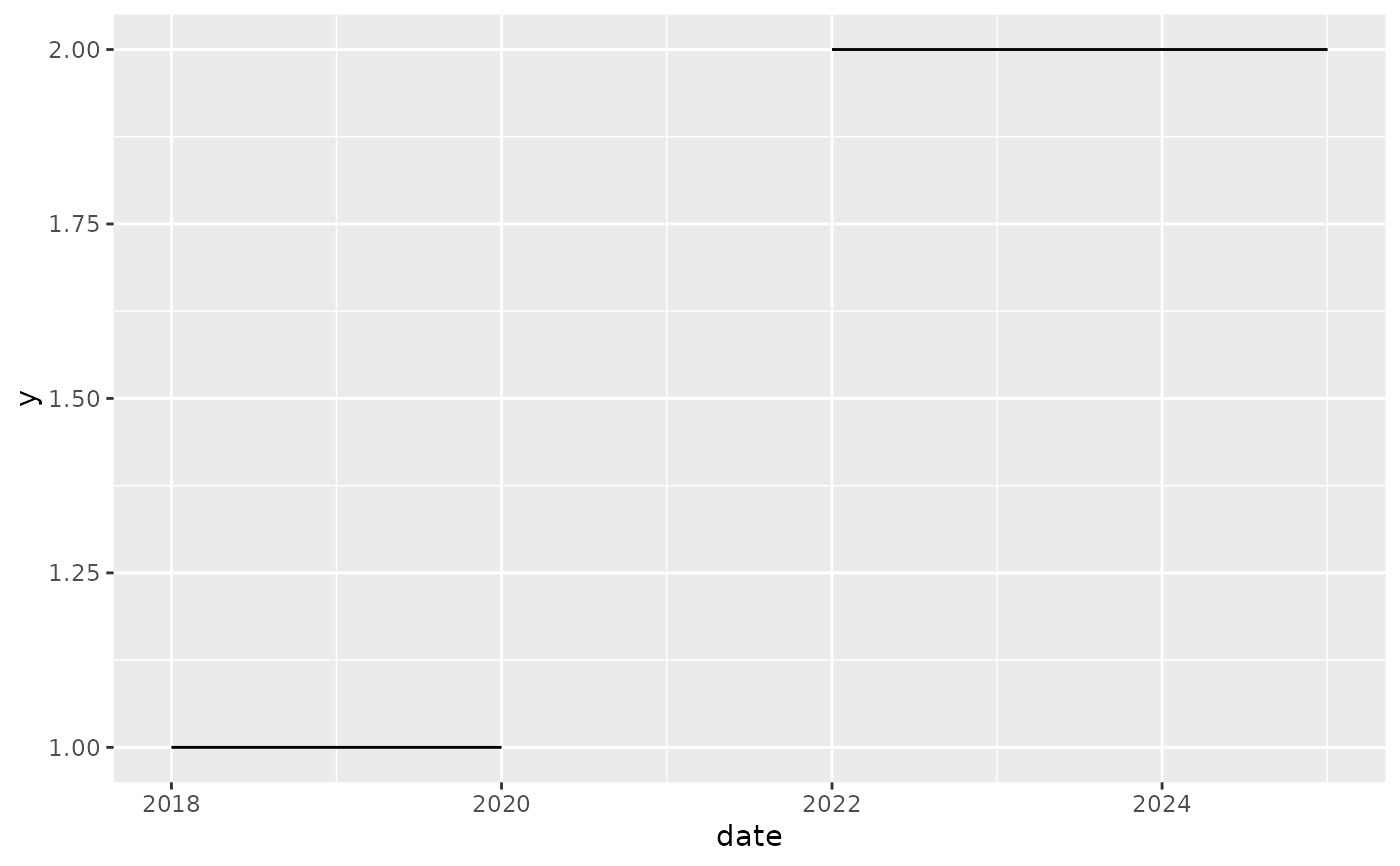
 ggplot(df, aes(x = date, y = y, group = id)) + geom_line()
 # Shortcut for integer years:
yr <- c(2002:2005, 2007:2010)
data.frame(year = yr, id = id_date_sequence(yr))
#> year id
#> 1 2002 1
#> 2 2003 1
#> 3 2004 1
#> 4 2005 1
#> 5 2007 2
#> 6 2008 2
#> 7 2009 2
#> 8 2010 2
# Shortcut for integer years:
yr <- c(2002:2005, 2007:2010)
data.frame(year = yr, id = id_date_sequence(yr))
#> year id
#> 1 2002 1
#> 2 2003 1
#> 3 2004 1
#> 4 2005 1
#> 5 2007 2
#> 6 2008 2
#> 7 2009 2
#> 8 2010 2