Visualize missing and non-proper cases for state panel data
Source:R/plot-missing.R
plot_missing.RdPlot missing values by country and date, and additionally identify country-date cases that do or do not match an independent state list.
plot_missing(
  data,
  x = NULL,
  ccode = NULL,
  time = NULL,
  period = NULL,
  statelist = NULL,
  partial = "any",
  skip_labels = 5,
  space = deprecated()
)

missing_info(
  data,
  x = NULL,
  ccode = NULL,
  time = NULL,
  period = NULL,
  statelist = NULL,
  partial = NULL,
  space = deprecated()
)
Arguments
- data
State panel data frame
- x
Variable names(s), e.g. "x" or c("x1", "x2"). Default is NULL, in which case all columns expect the ccode and time ID columns will be used.
- ccode
Name of variable identifying state country codes. If NULL (default) and one of "gwcode" or "cowcode" is a column in the data, it will be used.
- time
Name of time identifier. If NULL and a "date" or "year" column are in the data, they will be used ("year", preferentially, if both are present)
- period
Time period in which the data are. NULL by default and inferred to be "year" if the "time" column has name "year" or contains integers with a range between 1799 and 2050. Required if the "time" column is a
base::Date()vector to avoid ambiguity.- statelist
Check not only missing values, but presence or absence of observations against a list of independent states? One of "GW", "COW" or "none". NULL by default, in which case it will be inferred if the ccode columns have the name "gwcode" or "cowcode", and "none" otherwise.
- partial
Option for how to handle edge cases where a state is independent for only part of a time period (year, month, etc.). Options include "exact", and "any". See
state_panel()for details. If NULL (default) and the "time" column is a date, it will be set to "exact", for yearly "time" columns it will be set to "any".- skip_labels
Only plot the label for every n-th country on the y-axis to avoid overplotting.
- space
Deprecated, use "ccode" argument instead.
Value
plot_missing returns a ggplot2 object.
missing_info returns a data frame with components:
- ccode
ccode identifier, with name equal to the "ccode" argument, e.g. "ccode".
- time
Time identifier, with name equal to the "time" argument, e.g. "date".
- independent
A logical vector, is the statelist argument is none, NA.
- missing_value
A logical vector indicating if that record has missing values
- status
The label used for plotting, combining the independence and missing value information for a case as appropriate.
Details
missing_info provides the information that is plotted with
plot_missing. The latter returns a ggplot, and thus can be chained
with other ggplot functions as usual.
Examples
# Create an example data frame with missing values
cy <- state_panel(as.Date("1980-06-30"), as.Date("2015-06-30"), by = "year",
useGW = TRUE)
cy$myvar <- rnorm(nrow(cy))
set.seed(1234)
cy$myvar[sample(1:nrow(cy), nrow(cy)*.1, replace = FALSE)] <- NA
str(cy)
#> 'data.frame': 6680 obs. of 3 variables:
#> $ gwcode: int 2 2 2 2 2 2 2 2 2 2 ...
#> $ year : int 1980 1981 1982 1983 1984 1985 1986 1987 1988 1989 ...
#> $ myvar : num -1.096 0.388 -0.755 -1.232 0.764 ...
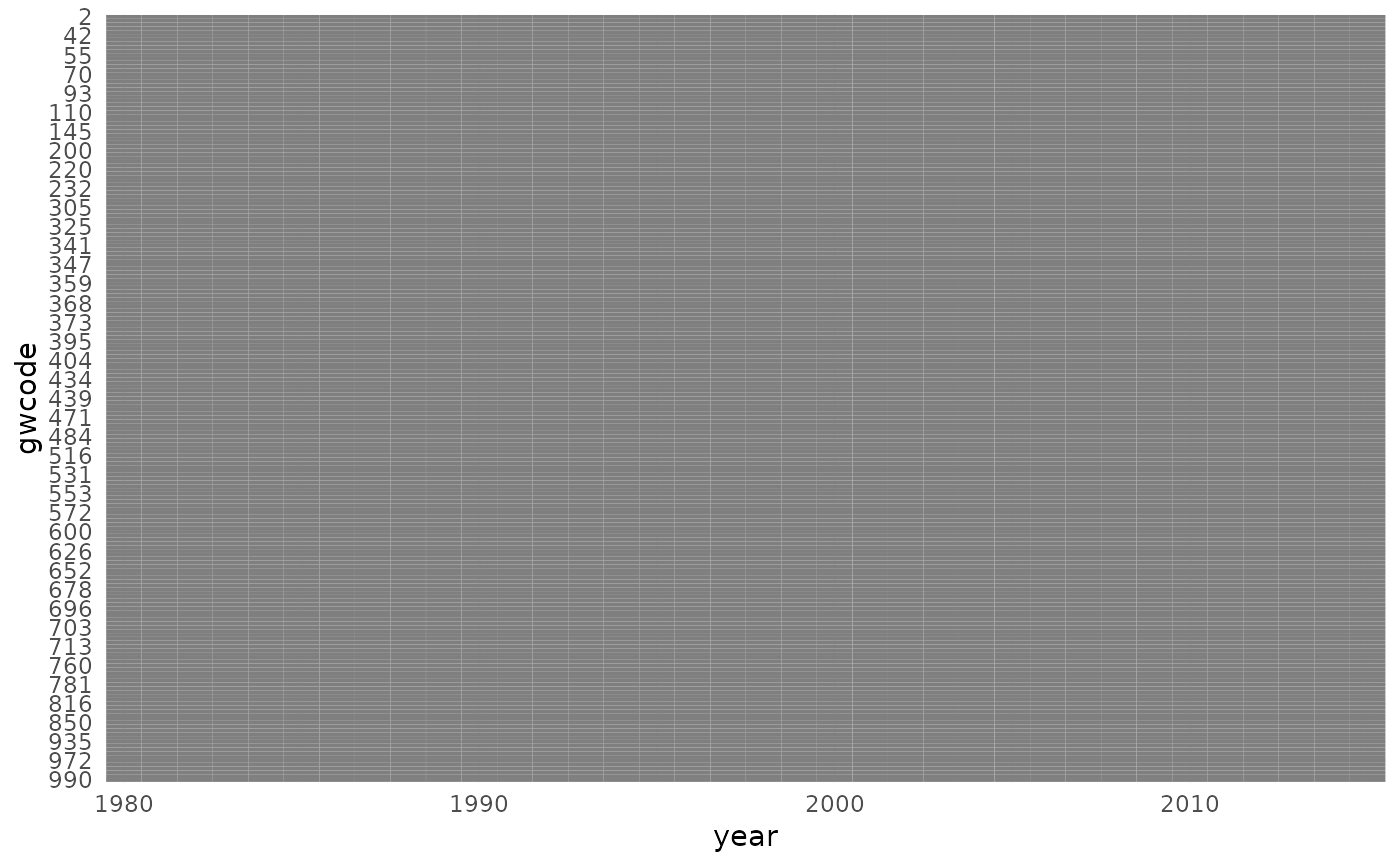
# Visualize missing values:
plot_missing(cy, statelist = "none")
 # missing_info() generates the data underlying plot_missing():
head(missing_info(cy, statelist = "none"))
#> gwcode year independent missing_value status
#> 1 2 1980-01-01 NA FALSE Complete
#> 202 2 1981-01-01 NA FALSE Complete
#> 403 2 1982-01-01 NA FALSE Complete
#> 604 2 1983-01-01 NA FALSE Complete
#> 805 2 1984-01-01 NA FALSE Complete
#> 1006 2 1985-01-01 NA FALSE Complete
# if we specify a statelist to check against, 'independent' will have values
# now:
head(missing_info(cy, statelist = "GW"))
#> gwcode year independent missing_value status
#> 1 2 1980-01-01 1 FALSE Complete, independent
#> 2 2 1981-01-01 1 FALSE Complete, independent
#> 3 2 1982-01-01 1 FALSE Complete, independent
#> 4 2 1983-01-01 1 FALSE Complete, independent
#> 5 2 1984-01-01 1 FALSE Complete, independent
#> 6 2 1985-01-01 1 FALSE Complete, independent
# Check data also against G&W list of independent states
head(missing_info(cy, statelist = "GW"))
#> gwcode year independent missing_value status
#> 1 2 1980-01-01 1 FALSE Complete, independent
#> 2 2 1981-01-01 1 FALSE Complete, independent
#> 3 2 1982-01-01 1 FALSE Complete, independent
#> 4 2 1983-01-01 1 FALSE Complete, independent
#> 5 2 1984-01-01 1 FALSE Complete, independent
#> 6 2 1985-01-01 1 FALSE Complete, independent
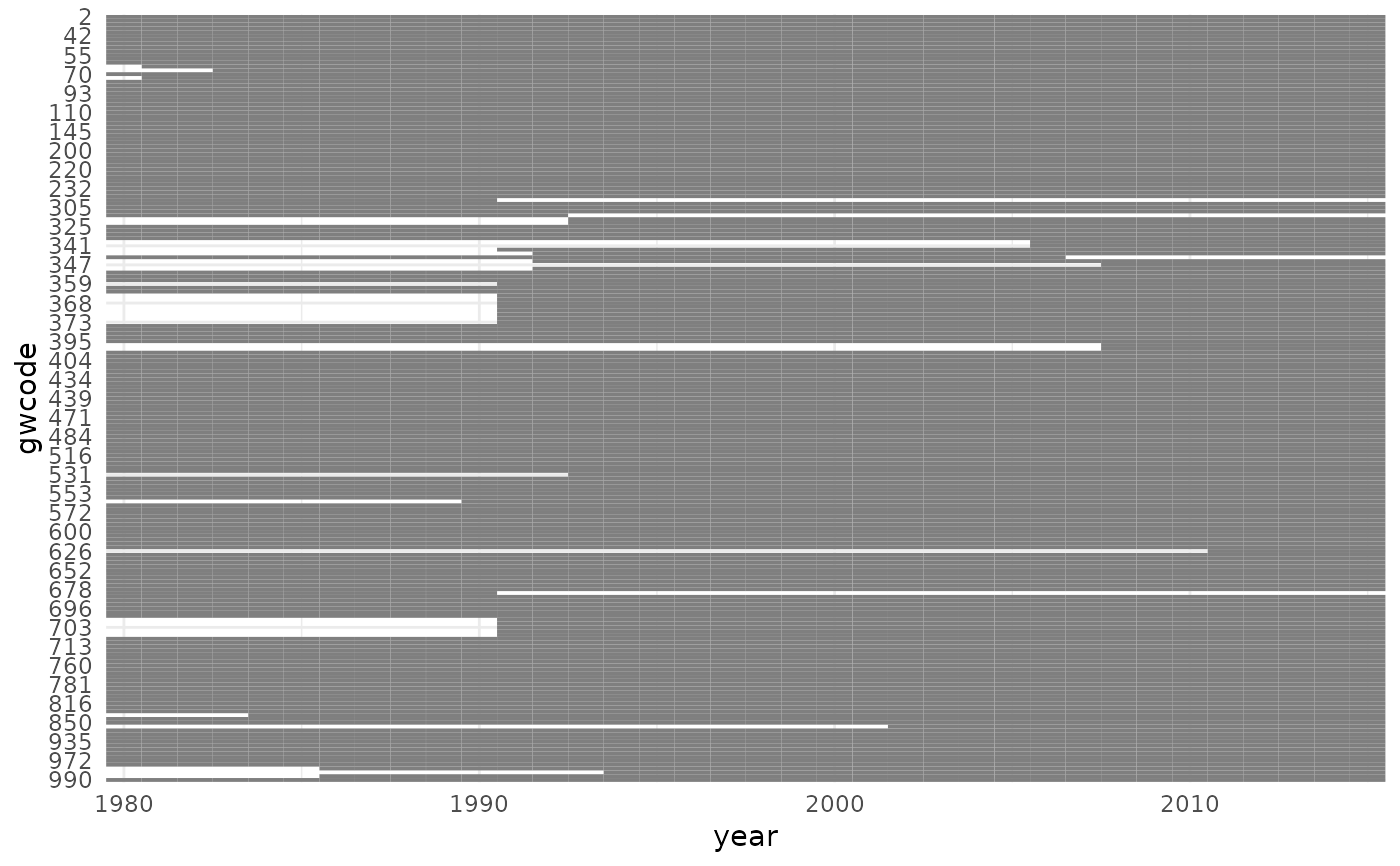
plot_missing(cy, statelist = "GW")
# missing_info() generates the data underlying plot_missing():
head(missing_info(cy, statelist = "none"))
#> gwcode year independent missing_value status
#> 1 2 1980-01-01 NA FALSE Complete
#> 202 2 1981-01-01 NA FALSE Complete
#> 403 2 1982-01-01 NA FALSE Complete
#> 604 2 1983-01-01 NA FALSE Complete
#> 805 2 1984-01-01 NA FALSE Complete
#> 1006 2 1985-01-01 NA FALSE Complete
# if we specify a statelist to check against, 'independent' will have values
# now:
head(missing_info(cy, statelist = "GW"))
#> gwcode year independent missing_value status
#> 1 2 1980-01-01 1 FALSE Complete, independent
#> 2 2 1981-01-01 1 FALSE Complete, independent
#> 3 2 1982-01-01 1 FALSE Complete, independent
#> 4 2 1983-01-01 1 FALSE Complete, independent
#> 5 2 1984-01-01 1 FALSE Complete, independent
#> 6 2 1985-01-01 1 FALSE Complete, independent
# Check data also against G&W list of independent states
head(missing_info(cy, statelist = "GW"))
#> gwcode year independent missing_value status
#> 1 2 1980-01-01 1 FALSE Complete, independent
#> 2 2 1981-01-01 1 FALSE Complete, independent
#> 3 2 1982-01-01 1 FALSE Complete, independent
#> 4 2 1983-01-01 1 FALSE Complete, independent
#> 5 2 1984-01-01 1 FALSE Complete, independent
#> 6 2 1985-01-01 1 FALSE Complete, independent
plot_missing(cy, statelist = "GW")
 # Live example with Polity data
data("polity")
head(polity)
#> ccode year polity
#> 1 700 1800 -6
#> 2 700 1801 -6
#> 3 700 1802 -6
#> 4 700 1803 -6
#> 5 700 1804 -6
#> 6 700 1805 -6
plot_missing(polity, x = "polity", ccode = "ccode", time = "year",
statelist = "COW")
# Live example with Polity data
data("polity")
head(polity)
#> ccode year polity
#> 1 700 1800 -6
#> 2 700 1801 -6
#> 3 700 1802 -6
#> 4 700 1803 -6
#> 5 700 1804 -6
#> 6 700 1805 -6
plot_missing(polity, x = "polity", ccode = "ccode", time = "year",
statelist = "COW")
 # COW starts in 1816; Polity has excess data for several non-independent
# states after that date, and is missing coverage for several countries.
# The date option is relevant for years in which states gain or lose
# independence, so this will be slighlty different:
polity$date <- as.Date(paste0(polity$year, "-01-01"))
polity$year <- NULL
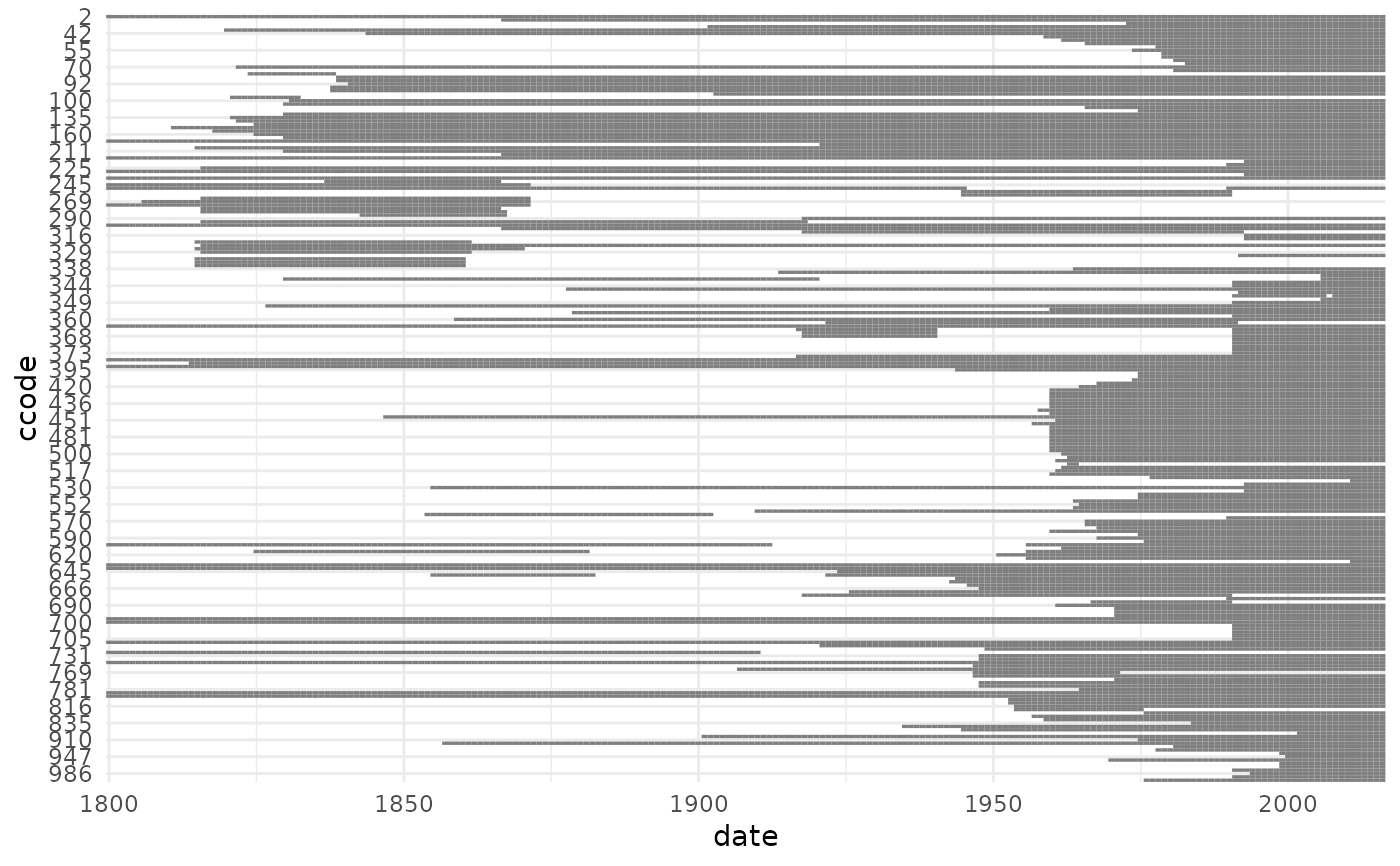
plot_missing(polity, x = "polity", ccode = "ccode", time = "date",
period = "year", statelist = "COW")
# COW starts in 1816; Polity has excess data for several non-independent
# states after that date, and is missing coverage for several countries.
# The date option is relevant for years in which states gain or lose
# independence, so this will be slighlty different:
polity$date <- as.Date(paste0(polity$year, "-01-01"))
polity$year <- NULL
plot_missing(polity, x = "polity", ccode = "ccode", time = "date",
period = "year", statelist = "COW")
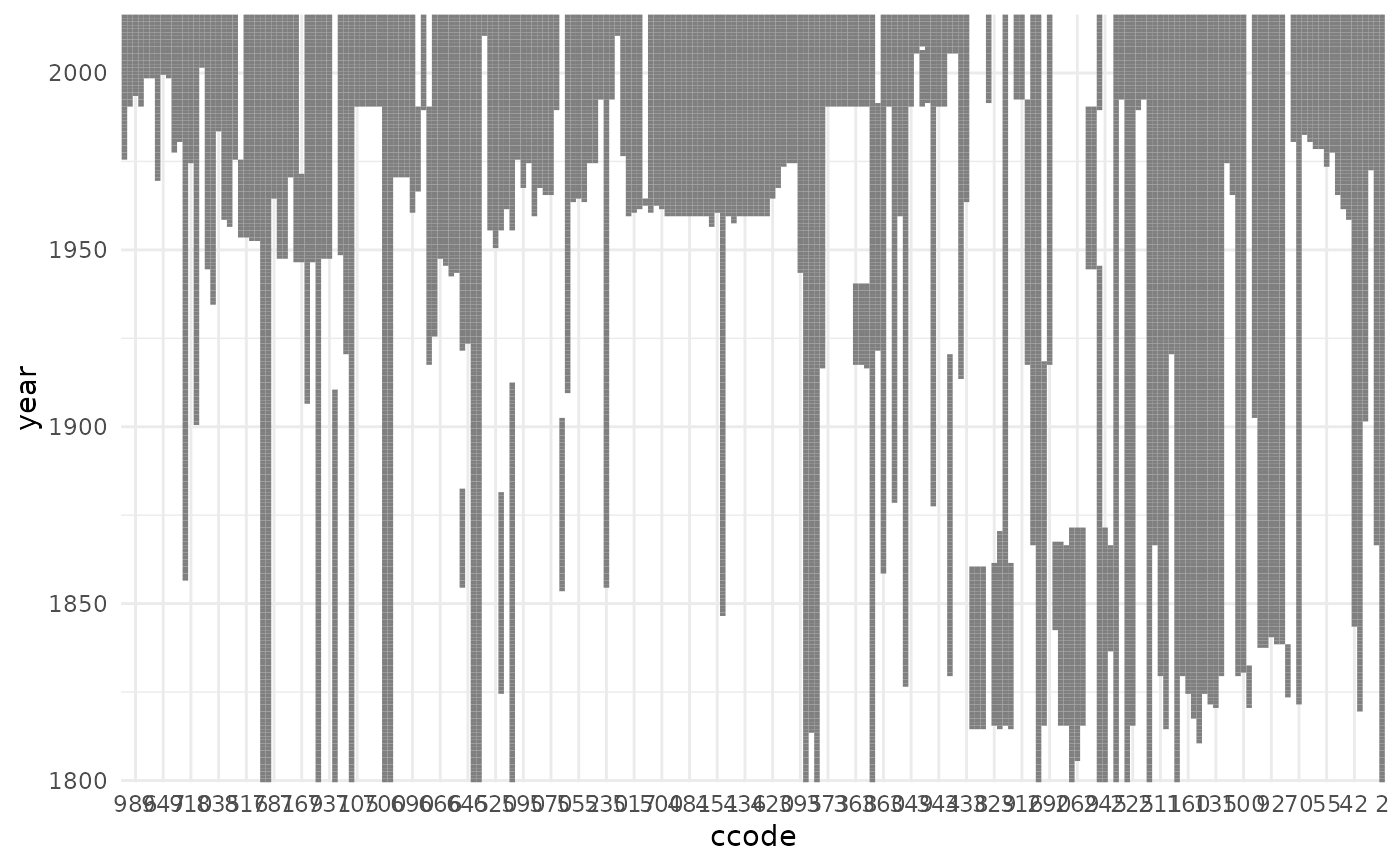
 # plot_missing returns a ggplot2 object, so you can do anything you want
polity$year <- as.integer(substr(polity$date, 1, 4))
polity$date <- NULL
plot_missing(polity, ccode = "ccode", statelist = "COW") +
ggplot2::coord_flip()
# plot_missing returns a ggplot2 object, so you can do anything you want
polity$year <- as.integer(substr(polity$date, 1, 4))
polity$date <- NULL
plot_missing(polity, ccode = "ccode", statelist = "COW") +
ggplot2::coord_flip()