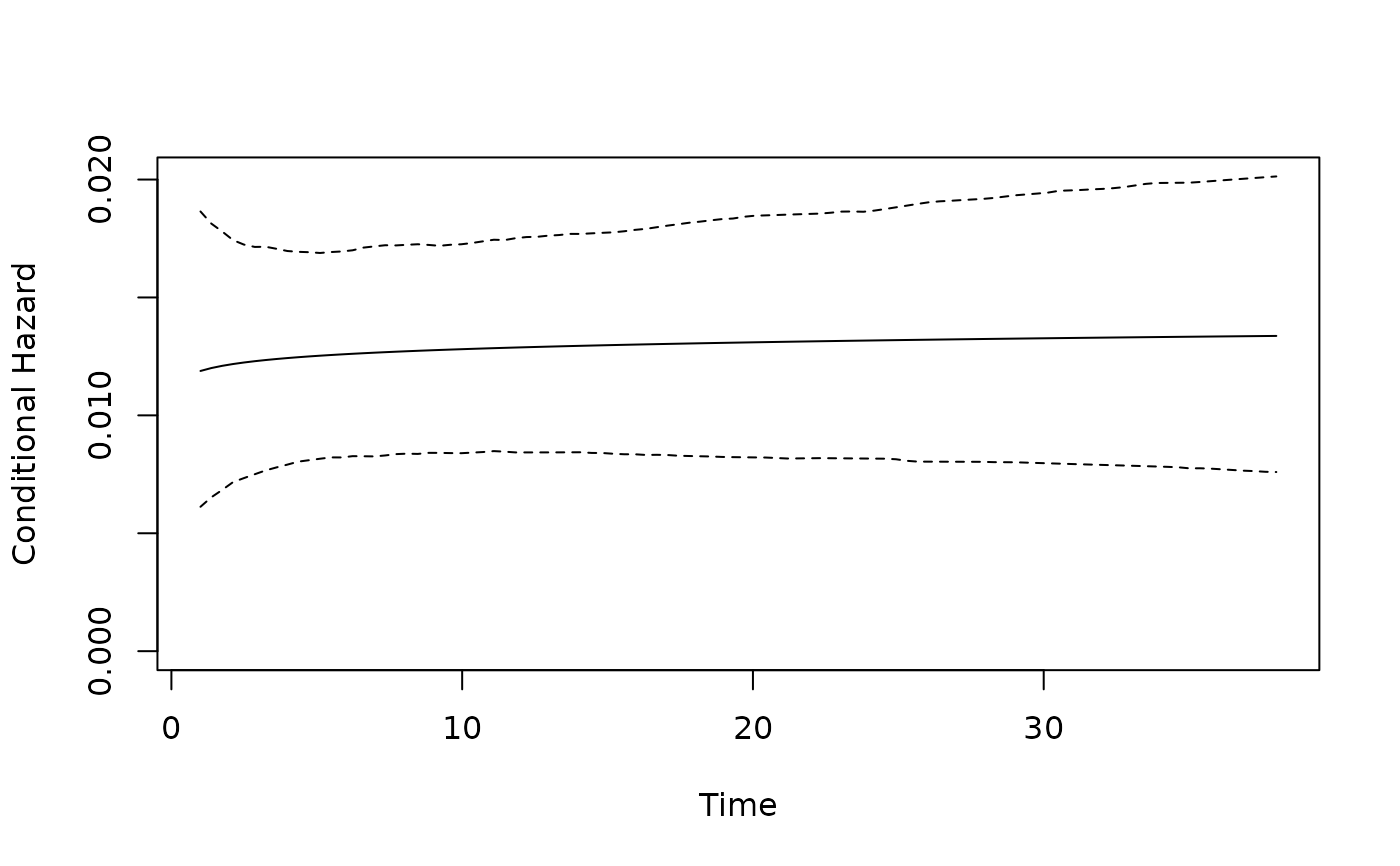
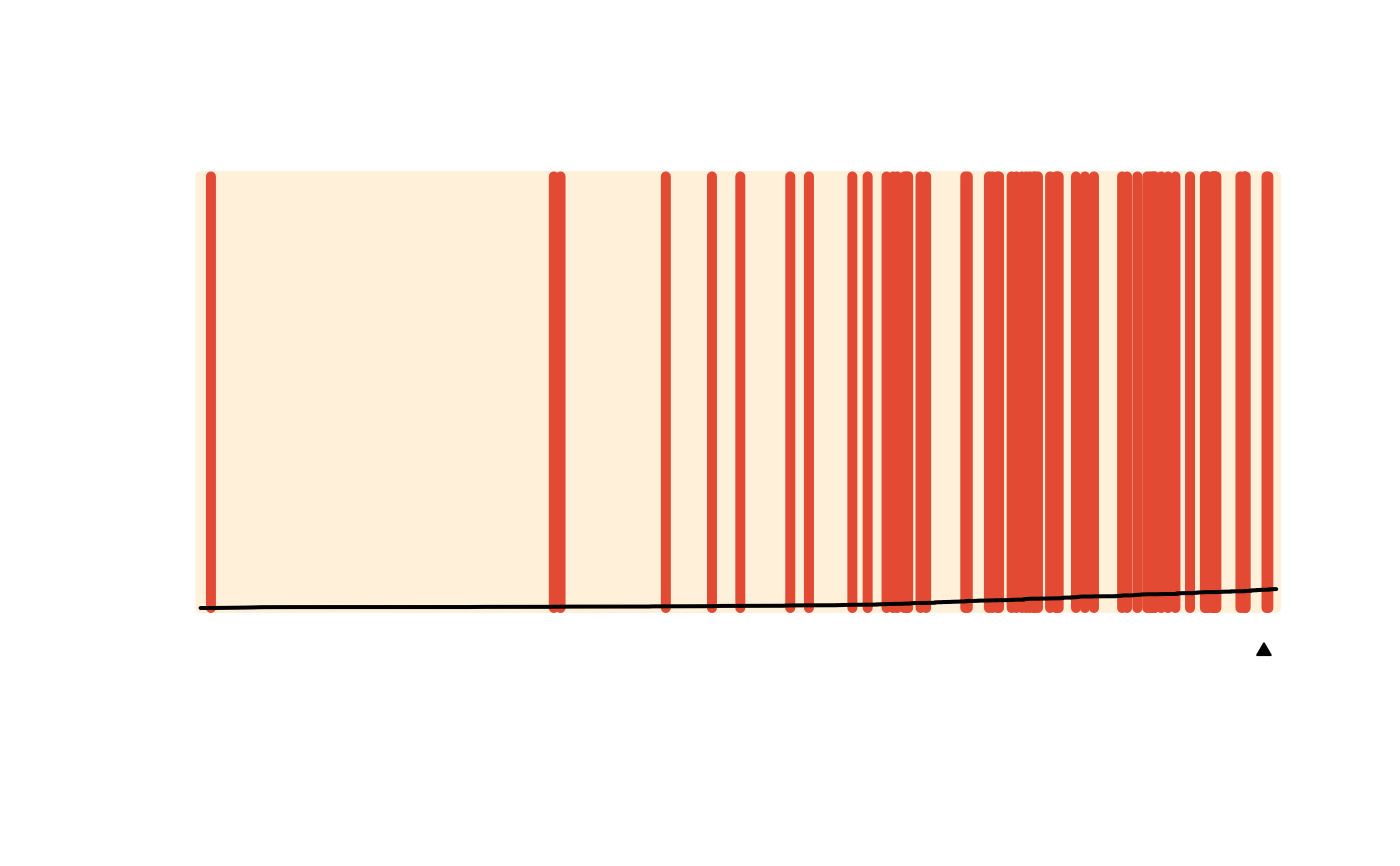
Plot results from a spduration model. Two types are currently implemented: a separation plot for evaluating model predictions ("sepplot"), and a plot of the conditional hazard rate ("hazard"), with or without simulation-based confidence intervals.
Usage
# S3 method for class 'spdur'
plot(x, type = "sepplot", ci = TRUE, ...)
Arguments
- x
An object of class "
spdur".- type
What kind of plot? "sepplot" or "hazard".
- ci
For plots of the hazard rate, should a confidence interval be included?
- ...
Optional parameters passed to
sepplotorplot_hazard.