Good coup, bad coup
Tags:
This post first appeared at Predictive Heuristics.
Alexander Noyes and Sebastian Elischer wrote about good coups on Monkey Cage a few weeks ago, in the shadow of fallout from the LaCour revelations. Good coups namely are those that lead to democratization, rather than outcomes one might more commonly associate with coups, like military rule, dictatorship, or instability. Elischer, although on the whole less optimistic about good coups than Noyes, writes:
There is some good news for those who want to believe in “good coups.” A number of military interventions in Africa have led to competitive multiparty elections, creating a necessary condition for successful democratization. These cases include the often (perhaps too often)-cited Malian coup of 1991, the Lesotho coup of 1991, the Nigerien coups of 1999 and 2000, the Guinean coup of 2008, the Malian coup of 2012 and potentially Burkina Faso’s 2014 coup, among others.
Here is a quick look at the larger picture. I took the same Powell and Thyne data on coups that is referenced in the blog posts and added the Polity data on regimes to it.1 Specifically, I added the Polity score 7 days before a coup, and 1 and 2 years afterwards, although I’ll focus on the changes 2 years later. The Polity score measures, on a scale from -10 to 10, how autocratic or democratic a regime is. The scale is in turn based on a larger number of items coded by the Polity project. It’s not quite an ordinal or interval scale, in part because there are a couple of special codes for regimes that are in transition or where a country is occupied or without a national government (failed state). Rather than exclude these special scores or convert them to Polity scores, I grouped the Polity scores into several broader categories from autocracy to full democracy, and kept the special codes under the label “unstable”, which may or may not be a good description for them.
The overwhelming pattern for all 227 successful coups that the data cover is that things stay the same (0.41 of cases) or get worse (0.40 of cases). The plot below shows the number of times specific category-to-category switches took place, with the regime 7 days before a successful coup on the y-axis, and the regime 2 years later on the x-axis. It’s really just a slightly more fancy version of a transition matrix.2
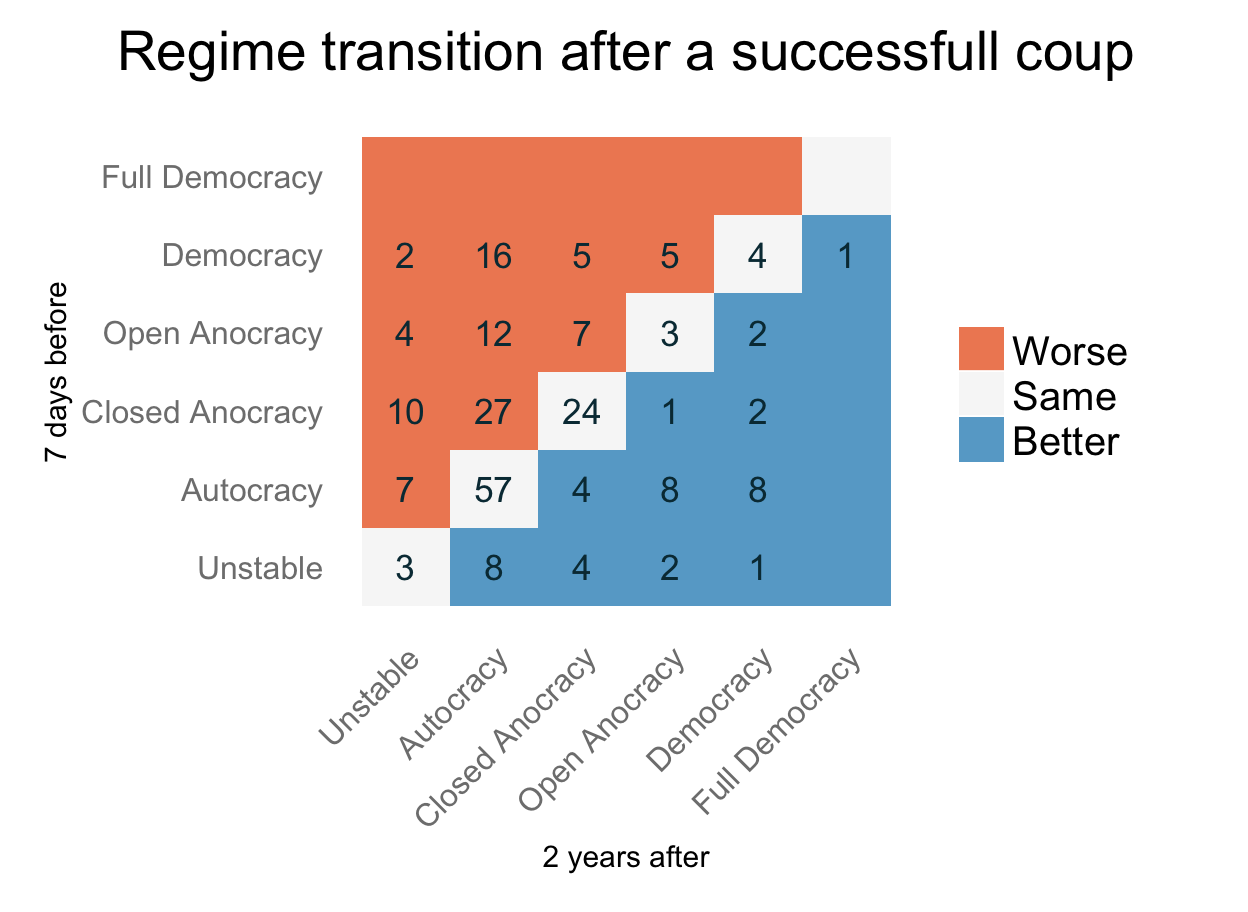
In 41, or 18 percent of cases, the regime was more democratic 2 years later. There are probably a few more that were still coded as being in transition to a more democratic regime, so the 18 percent is for unambiguously more democratic regimes.
Below is another way of visualizing the same data. I don’t know what this type of plot is called, but in any case the Gmisc R package implements a version of it:
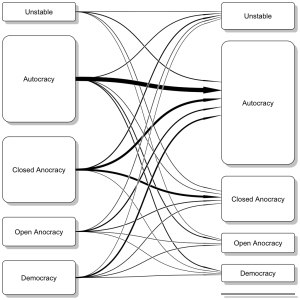
It’s maybe clearer with this plot that of the transitions that do occur, the modal change is to autocracy. The number of autocracies 2 years post-coup is clearly larger than before, at the expense of less autocratic, more liberal regimes. There was one transition from democracy to full democracy–the thin line on the bottom right, which was for Cyprus in 1974 after a short-lived coup that led to Turkish invasion and eventually the fall of the Greek dictatorship and restoration of the previous president.
By the way, I’m trying to consciously steer away from language implying causation here. This is after all a descriptive look at polity before and 2 years after a coup, and I have not dug into any particular case histories nor tried to control for any confounding factors. Forgive the occasional slip, and I don’t mean to imply causality when I use words like “transition”.
So, when we consider the whole data, coups have historically more often than not reinforced autocratic tendencies. The picture actually looks much better if you look at post-1990 Sub-Saharan Africa only, as Elischer’s Monkey Cage post does:
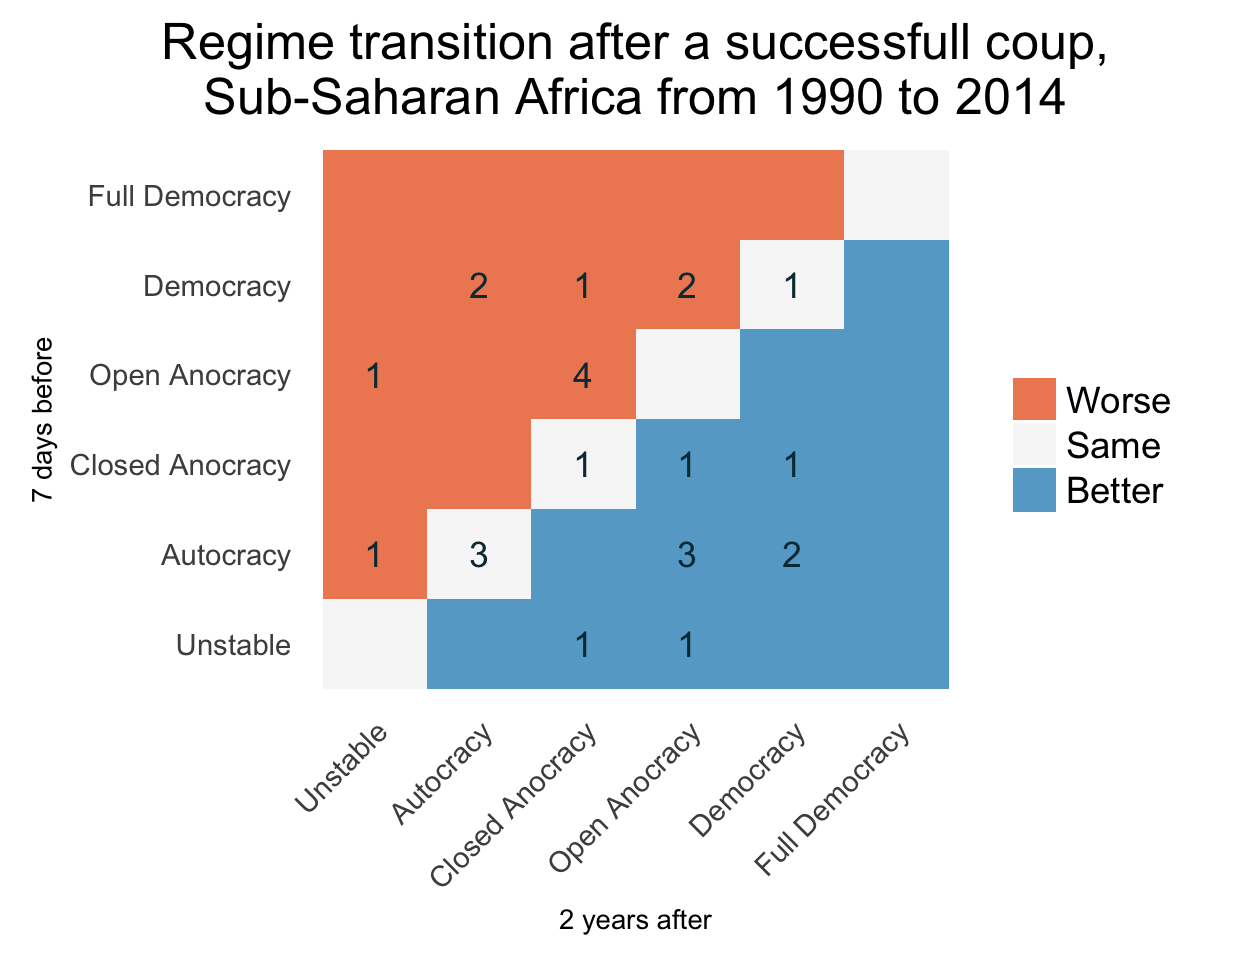
More than a third of coups in post-1990 Sub-Saharan Africa are followed by regime liberalization. To be honest I was a bit surprised that the ratio of “good” to “bad” coups is that high. Here is a timeline of the specific cases. I changed the colors so that “same” is now red as well. The labels are easier to read if you click to open the larger version of the image.
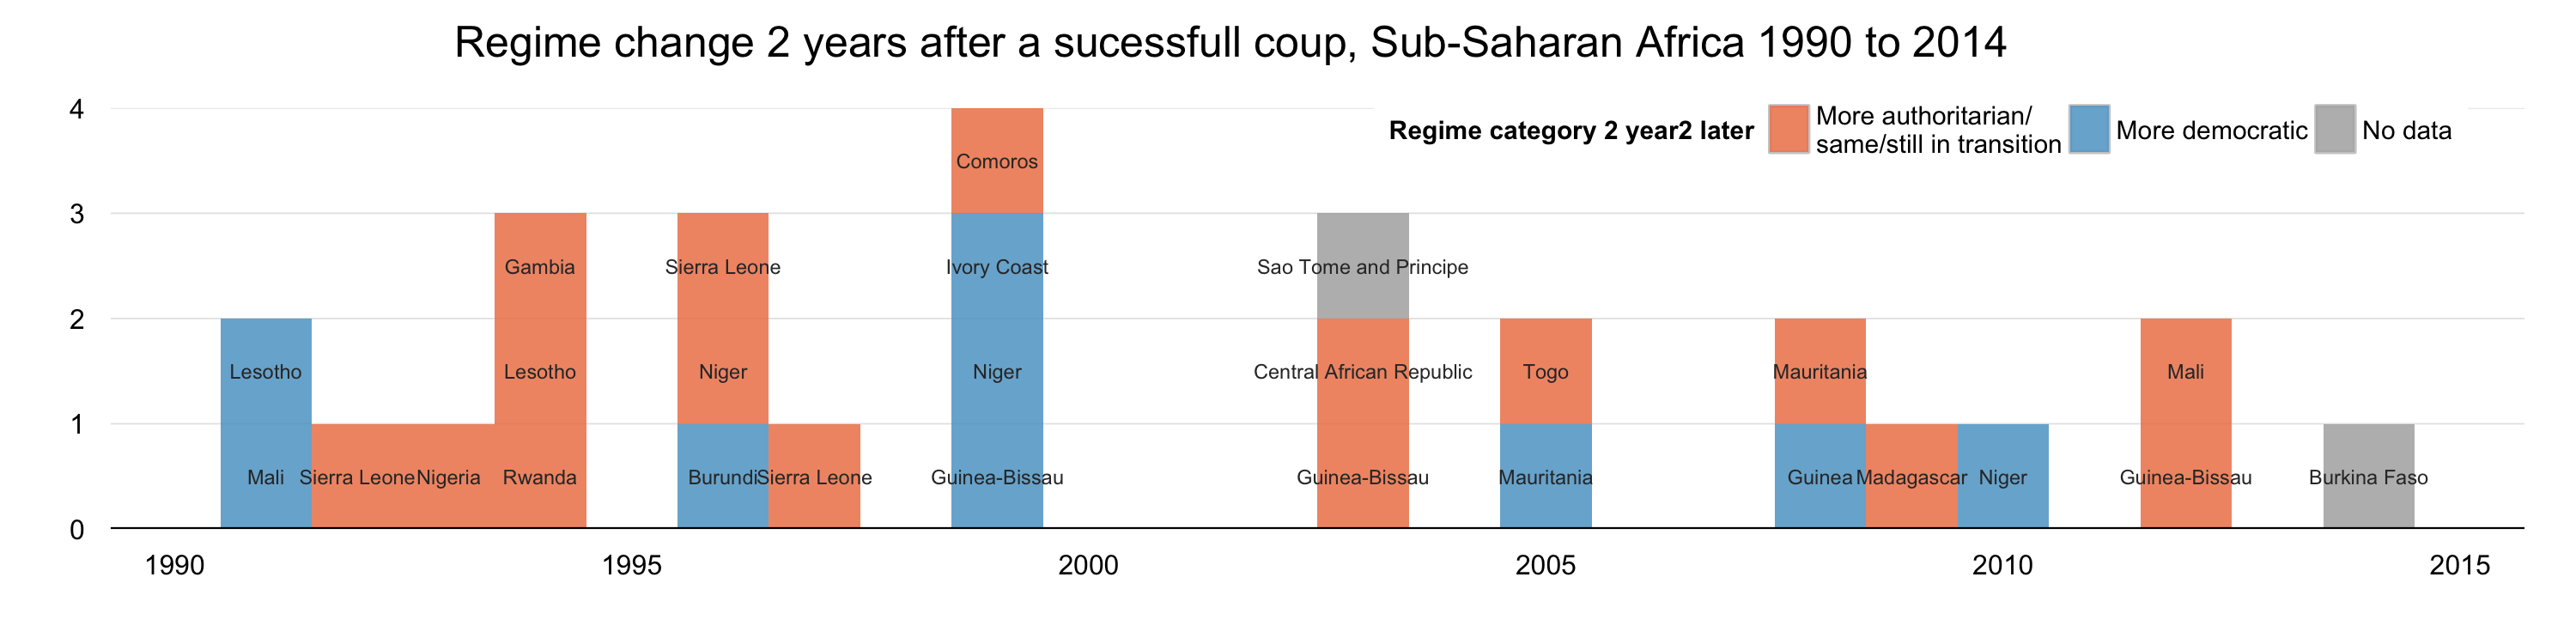
Niger has had 3 coups since 1990: in 1996, 1999, and 2010. In the first, Polity decreased a year after the coup, but the other two resulted in improvements. This matches the narrative in Elischer’s post, as he gives the second two Nigerien coups as examples of good coups. A couple of other countries also appear twice in this list. I’m not sure whether repeated good coups are still a good thing, but on the other hand I’m not very familiar with the particular case histories, so maybe they really are.
Like with the transition plots before, extending the time period and spatial focus to all countries from 1950 on changes the picture a lot:
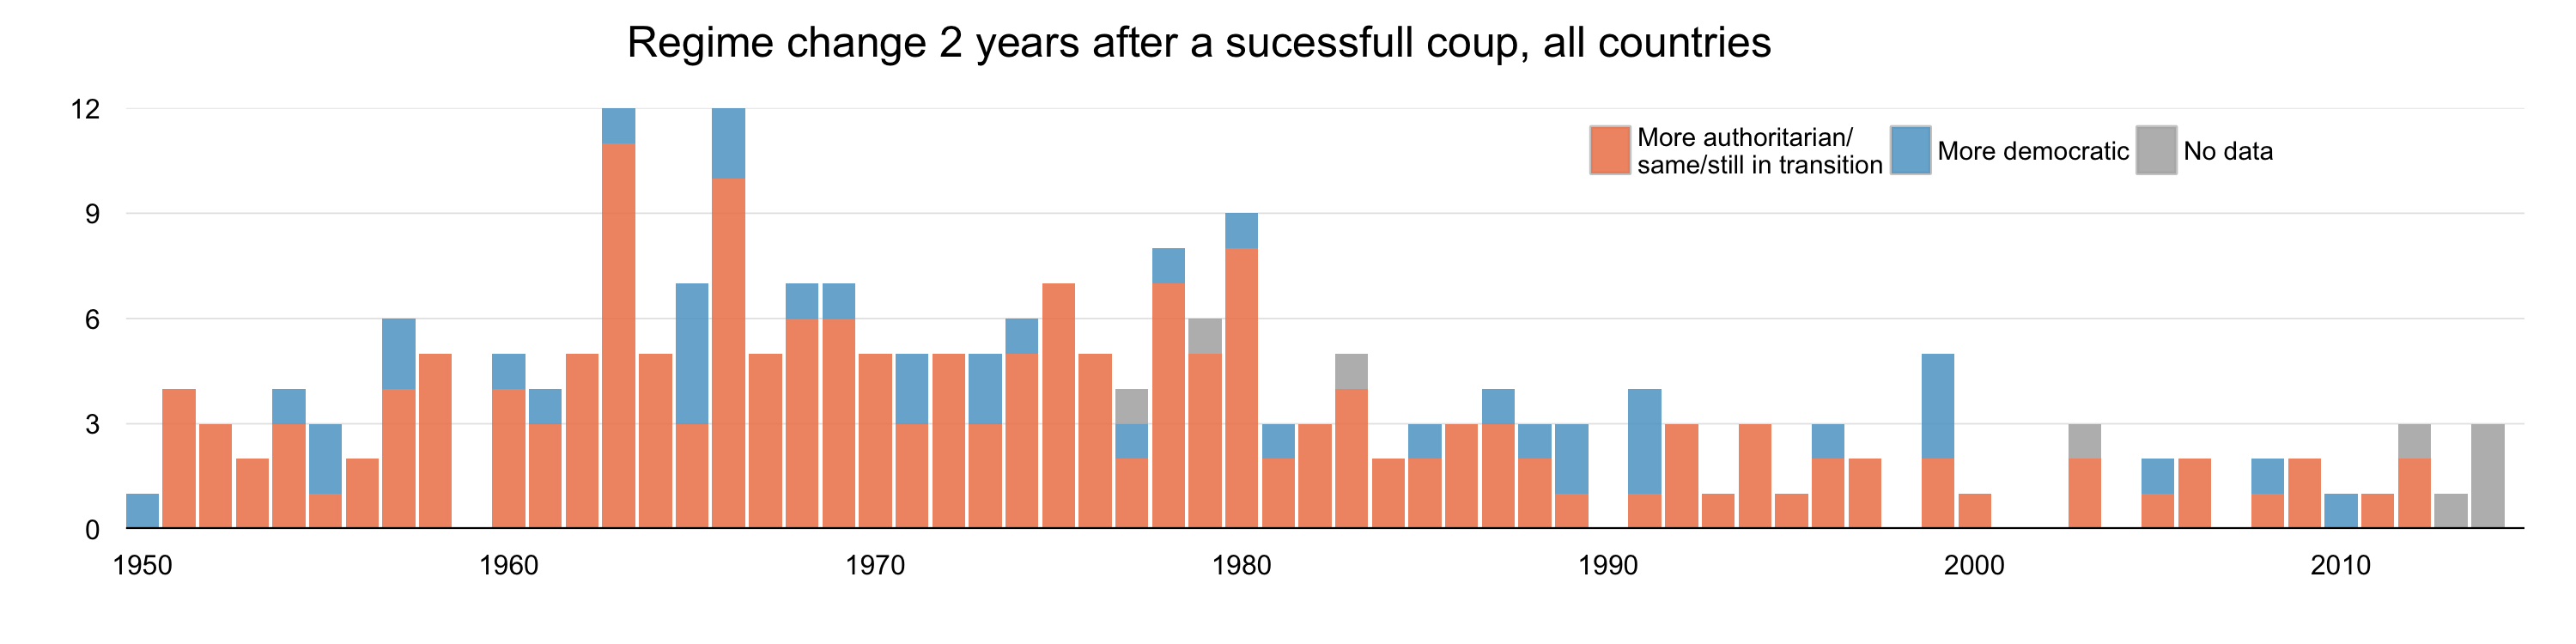
Most coups historically were “bad”, with more autocratic or unchanged regimes 2 years later. A few here and there seem to be associated with democratization, and while the number of bad coups has decreased over time from highs in the 60’s and 70’s, the good coups seem to continue with a steady trickle. Still, despite the occurrence of a substantial number of coups that are associated with democratization, the main pattern historically and still today is that successful coups more often than not associated with more of the same, or worse (autocratization3). The imbalance between positive and negative movements in regime is even more pronounced at shorter time scales, e.g. if you consider regime type 1 year after a coup, and the main immediate effect is probably instability and political deterioration.
Contrast this with Powell and Thyne,4 whose 2014 paper in Foreign Policy Analysis is one of the articles that started the mini-discussion on good coups. Powell and Thyne look at whether having had a coup or attempted but unsuccessful coup within the past 2 years is associated with democratization, which they operationalize as a shift in Polity score from less than 6 to 6 or higher. This is equivalent to a movement from any category below democracy to “Democracy” or “Full Democracy” in the categorization I have used here. They find that it does, and with further investigation show that the effect is even more pronounced in strongly autocratic regimes and those with a long-ruling leader.
How can coups increase the probability of democratization, while regimes tend to be similar or worse following a coup?
My empirically unevaluated hunch is that the trick is twofold: the data Powell and Thyne use consist only of autocracies (Polity < 6), and they only consider movement from not-democracy to democracy. To use a bad analogy, with this setup if a coup makes an autocracy more autocratic, nobody is there to hear it. In any case, I think that the explanation for the inconsistency is along these lines: coups perturb regimes, and sometimes these perturbations will be in the more democratic direction. So if you are only looking at whether countries cross a threshold from not democratic to democratic, you will find that coups will indeed sometimes push countries over the threshold.
Dan Carlin, in his podcasts on World War 1, has a great analogy about the quality of monarchs that came to mind here.5 He describes monarchical succession as a roll of the dice where sometimes you get great kings like Frederick II or Peter the Great, but other times you are stuck with the Wilhelm II or Nicholas II’s of the regal world. Based on the cursory look I’ve described here, coups are then akin to rolling a loaded dice. Sometimes they can lead to regimes that are more liberal, and if not outright democratic at least less autocratic. But more often, they are associated with no change or change in the wrong direction, in addition to other short-term costs they carry.
So while good coups happen, there are also associated risks. You shouldn’t consider potential benefits without the potential costs involved. The next logical step would be to try to figure out whether there are any systematic conditions that can help predict whether a coup would lead to liberalization, no meaningful change, or more autocracy. Powell and Thyne have a little bit of this when it comes to the benefit (democratization) side, e.g. that democratizing coups are more likely in highly autocratic regimes with aging leaders, but the potential risks are not clear. It seems like being able to predict what change in regime type a coup would likely lead to is also something policymakers would be interest in when evaluating how to respond to a coup or the possibility of one.
-
Jonathan Powell is doing a wonderful job, as far as I can tell, in keeping the data regularly updated. At least it has been updated every time I have looked on his website. ↩︎
-
I would like to plot the transition matrix with a <bivariate color scale so that it shows both whether a transition is to a more authoritarian/democratic regime, and also what the frequency of any given pair was. I.e. a cross between a qualitative and gradient scales, or specifically 3 separate gradient scales. But it seems that this is not possible with
ggplot2. If there were only two categories I could cheat with a diverging scale, alas there are three. ↩︎ -
If “democratization” is a word, it seems that “autocratization” should be as well. ↩︎
-
Thank you for posting an ungated copy of the paper, along with replication materials. ↩︎
-
Maybe he got it from somewhere else, I don’t know. ↩︎