When forecasting goes wrong (maybe): Yemen
Tags:
#Forecasts
From the Ward Lab blog a few weeks ago:
Over the past few months we have worked on regularly updating our irregular leadership change models and forecasts in order to provide monthly 6-month ahead forecasts of the probability of irregular leadership change in a large number of countries–but excluding the US–worldwide. Part of that effort has been the occasional glance back at our previous predictions, and particularly more in-depth examinations for notable cases that we missed or got right, to see whether we can improve our modeling as a result. This note is one of these glances back: a postmortem of our Yemen predictions for the first half of 2015.
To provide some background, the ILC forecasts are generated from an ensemble of seven thematic1 split-population duration models. For more details on how this works or what irregular leadership changes are and how we code them, take a look at our R&P paper or this longer arXiv writeup.
| Country | 6-month Prob. |
|---|---|
| Burkina Faso | 0.058 |
| Egypt | 0.055 |
| Ukraine | 0.044 |
| India | 0.038 |
| Somalia | 0.038 |
| Afghanistan | 0.035 |
| Nigeria | 0.030 |
Absent from either table is Yemen, which by the time we made the forecasts already seemed to have experienced an ILC, with President Hadi’s resignation in January, and flight to Saudi Arabia in March. Yemen was instead ranked 33 in our 6-month forecasts. The plot below shows the ranking of Yemen in the monthly forecasts from 2014 on:2
![]()
Data problems are not new in international relations, but a growing awareness of media and reporting biases in the data we do have maybe is, as a side-effect of the proliferation of event data over the past couple of years (hello GDELT).3 We are probably not normalizing as well as we should be, and how to properly normalize event data is something that merits greater investigation.
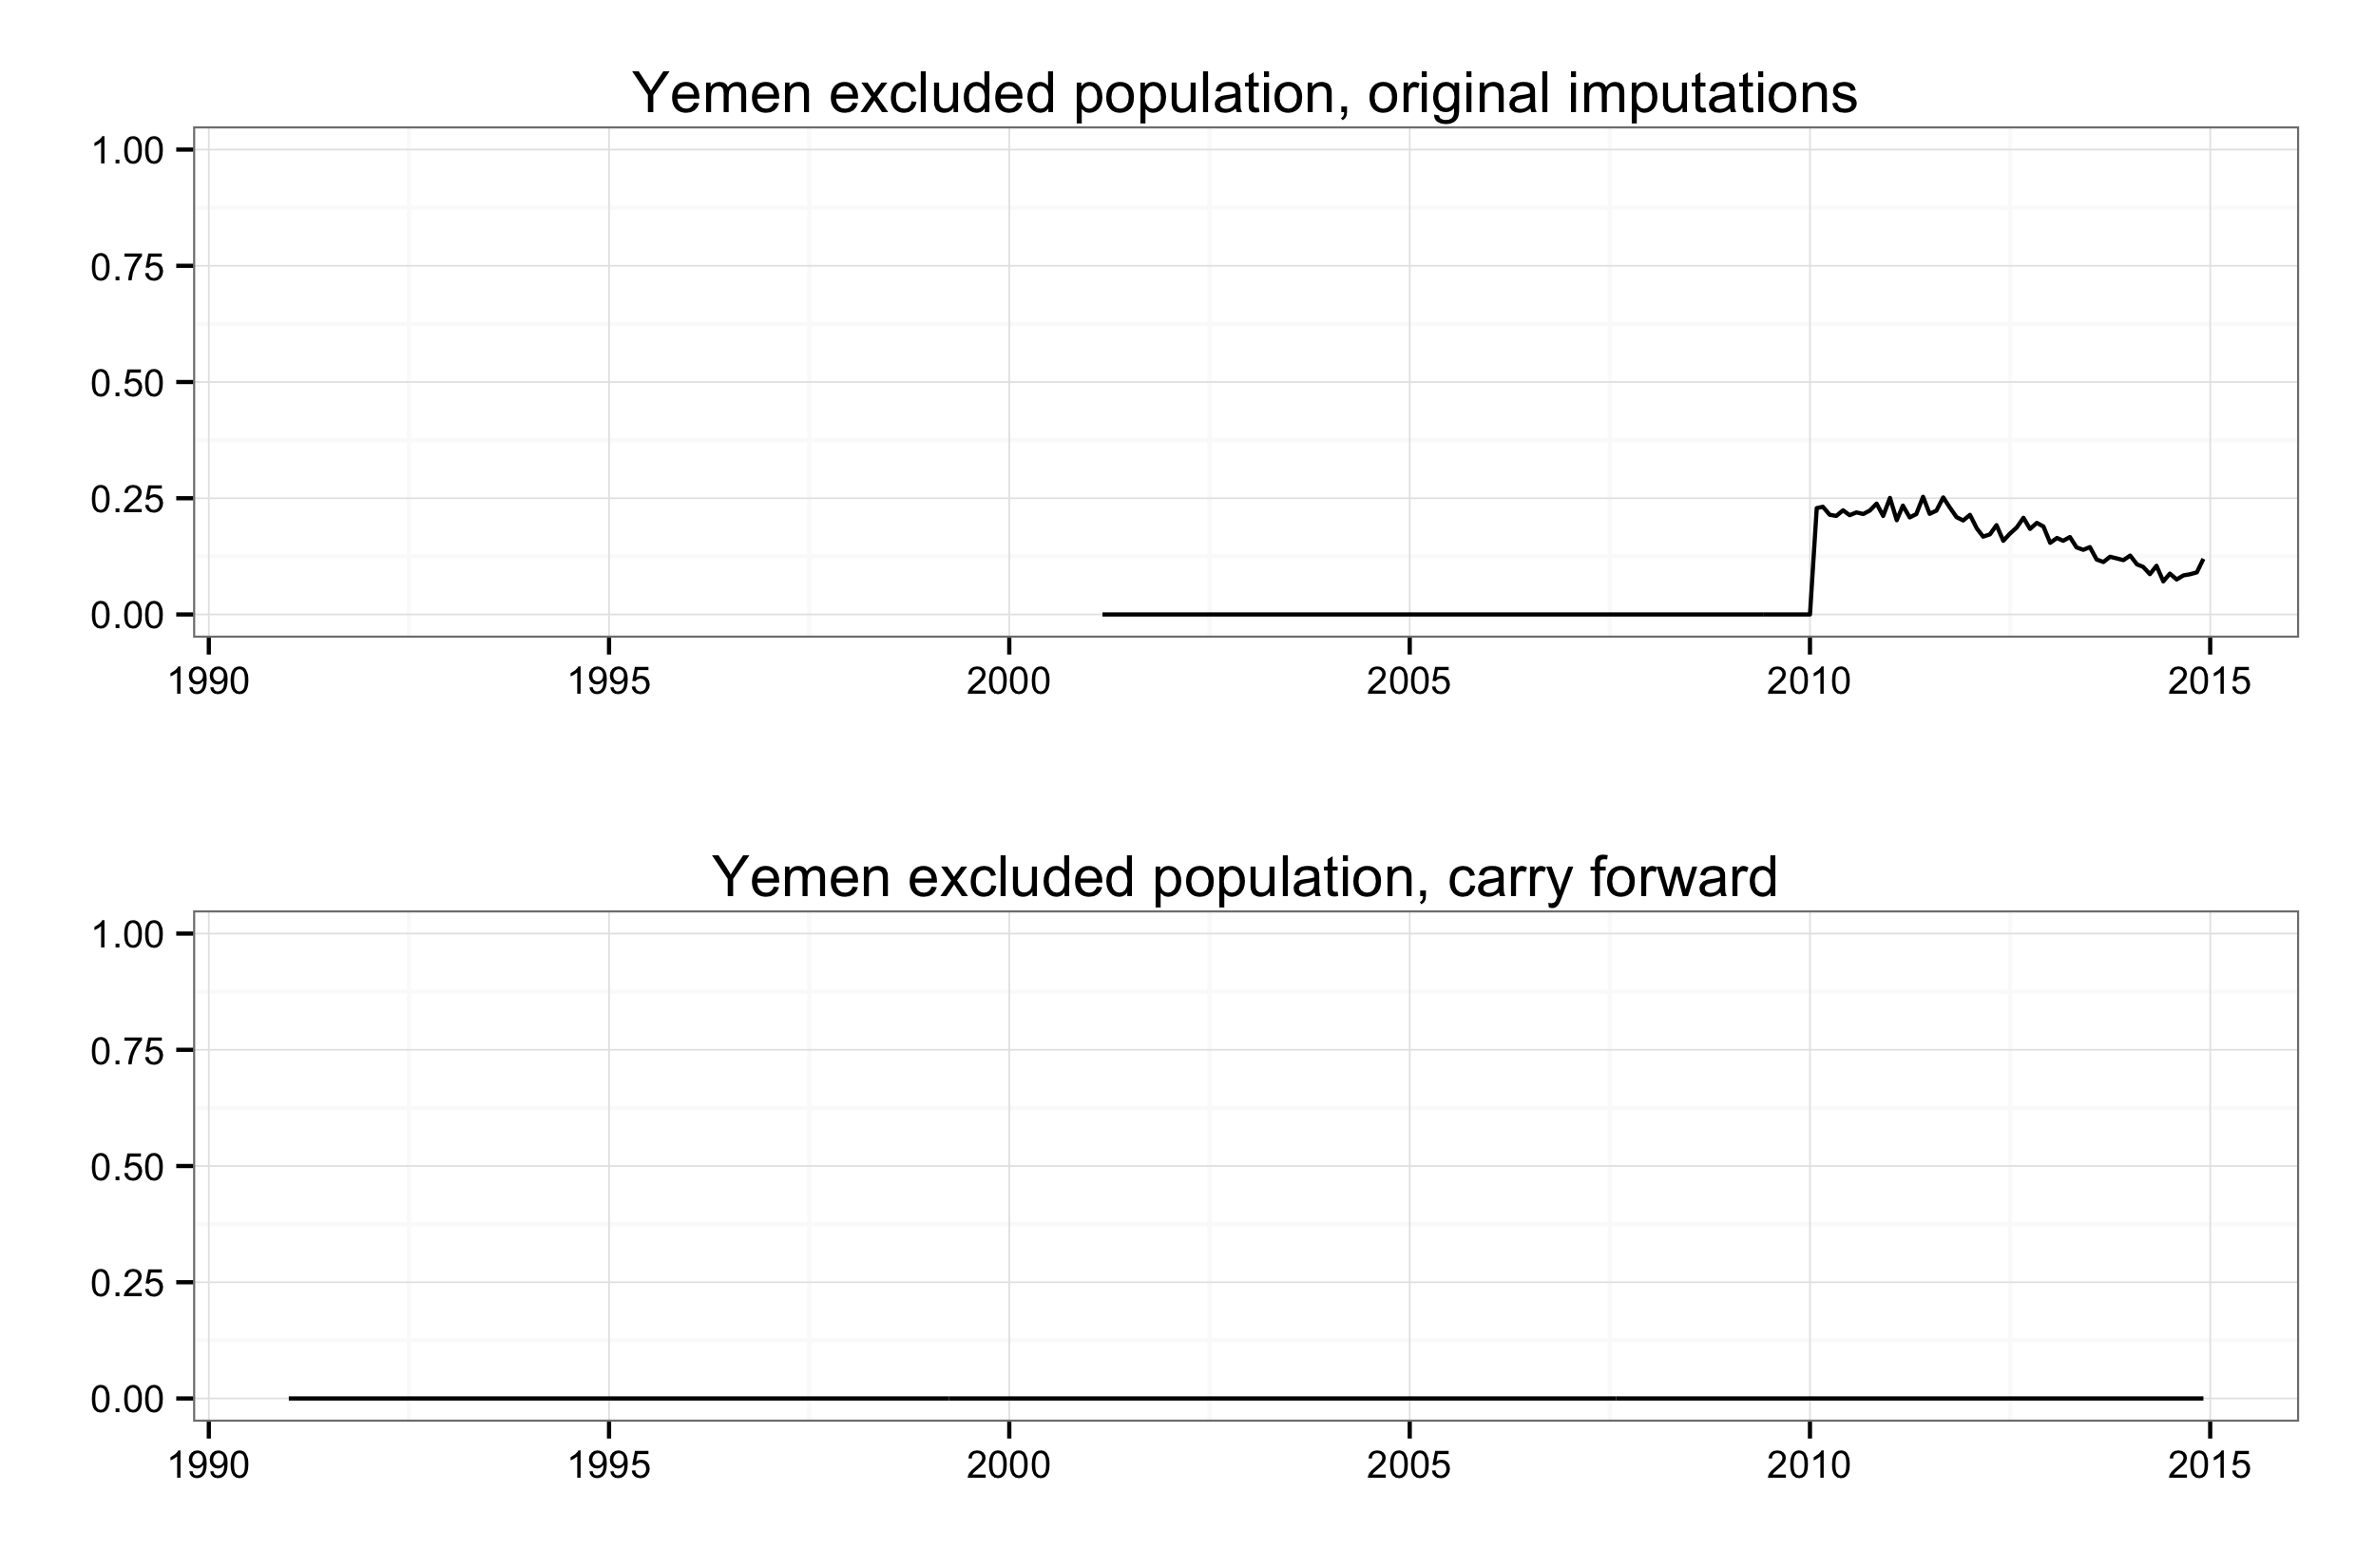
The top plot shows the original data we used. That shift from 2011 on is an artifact of imputation, also given away as such by the sub-annual variation that is impossible since EPR only tracks things in terms of years. Given that the EPR series are largely stable for countries, over stretches of decades, we switched instead to just carrying forward the last observed value.4
![]()
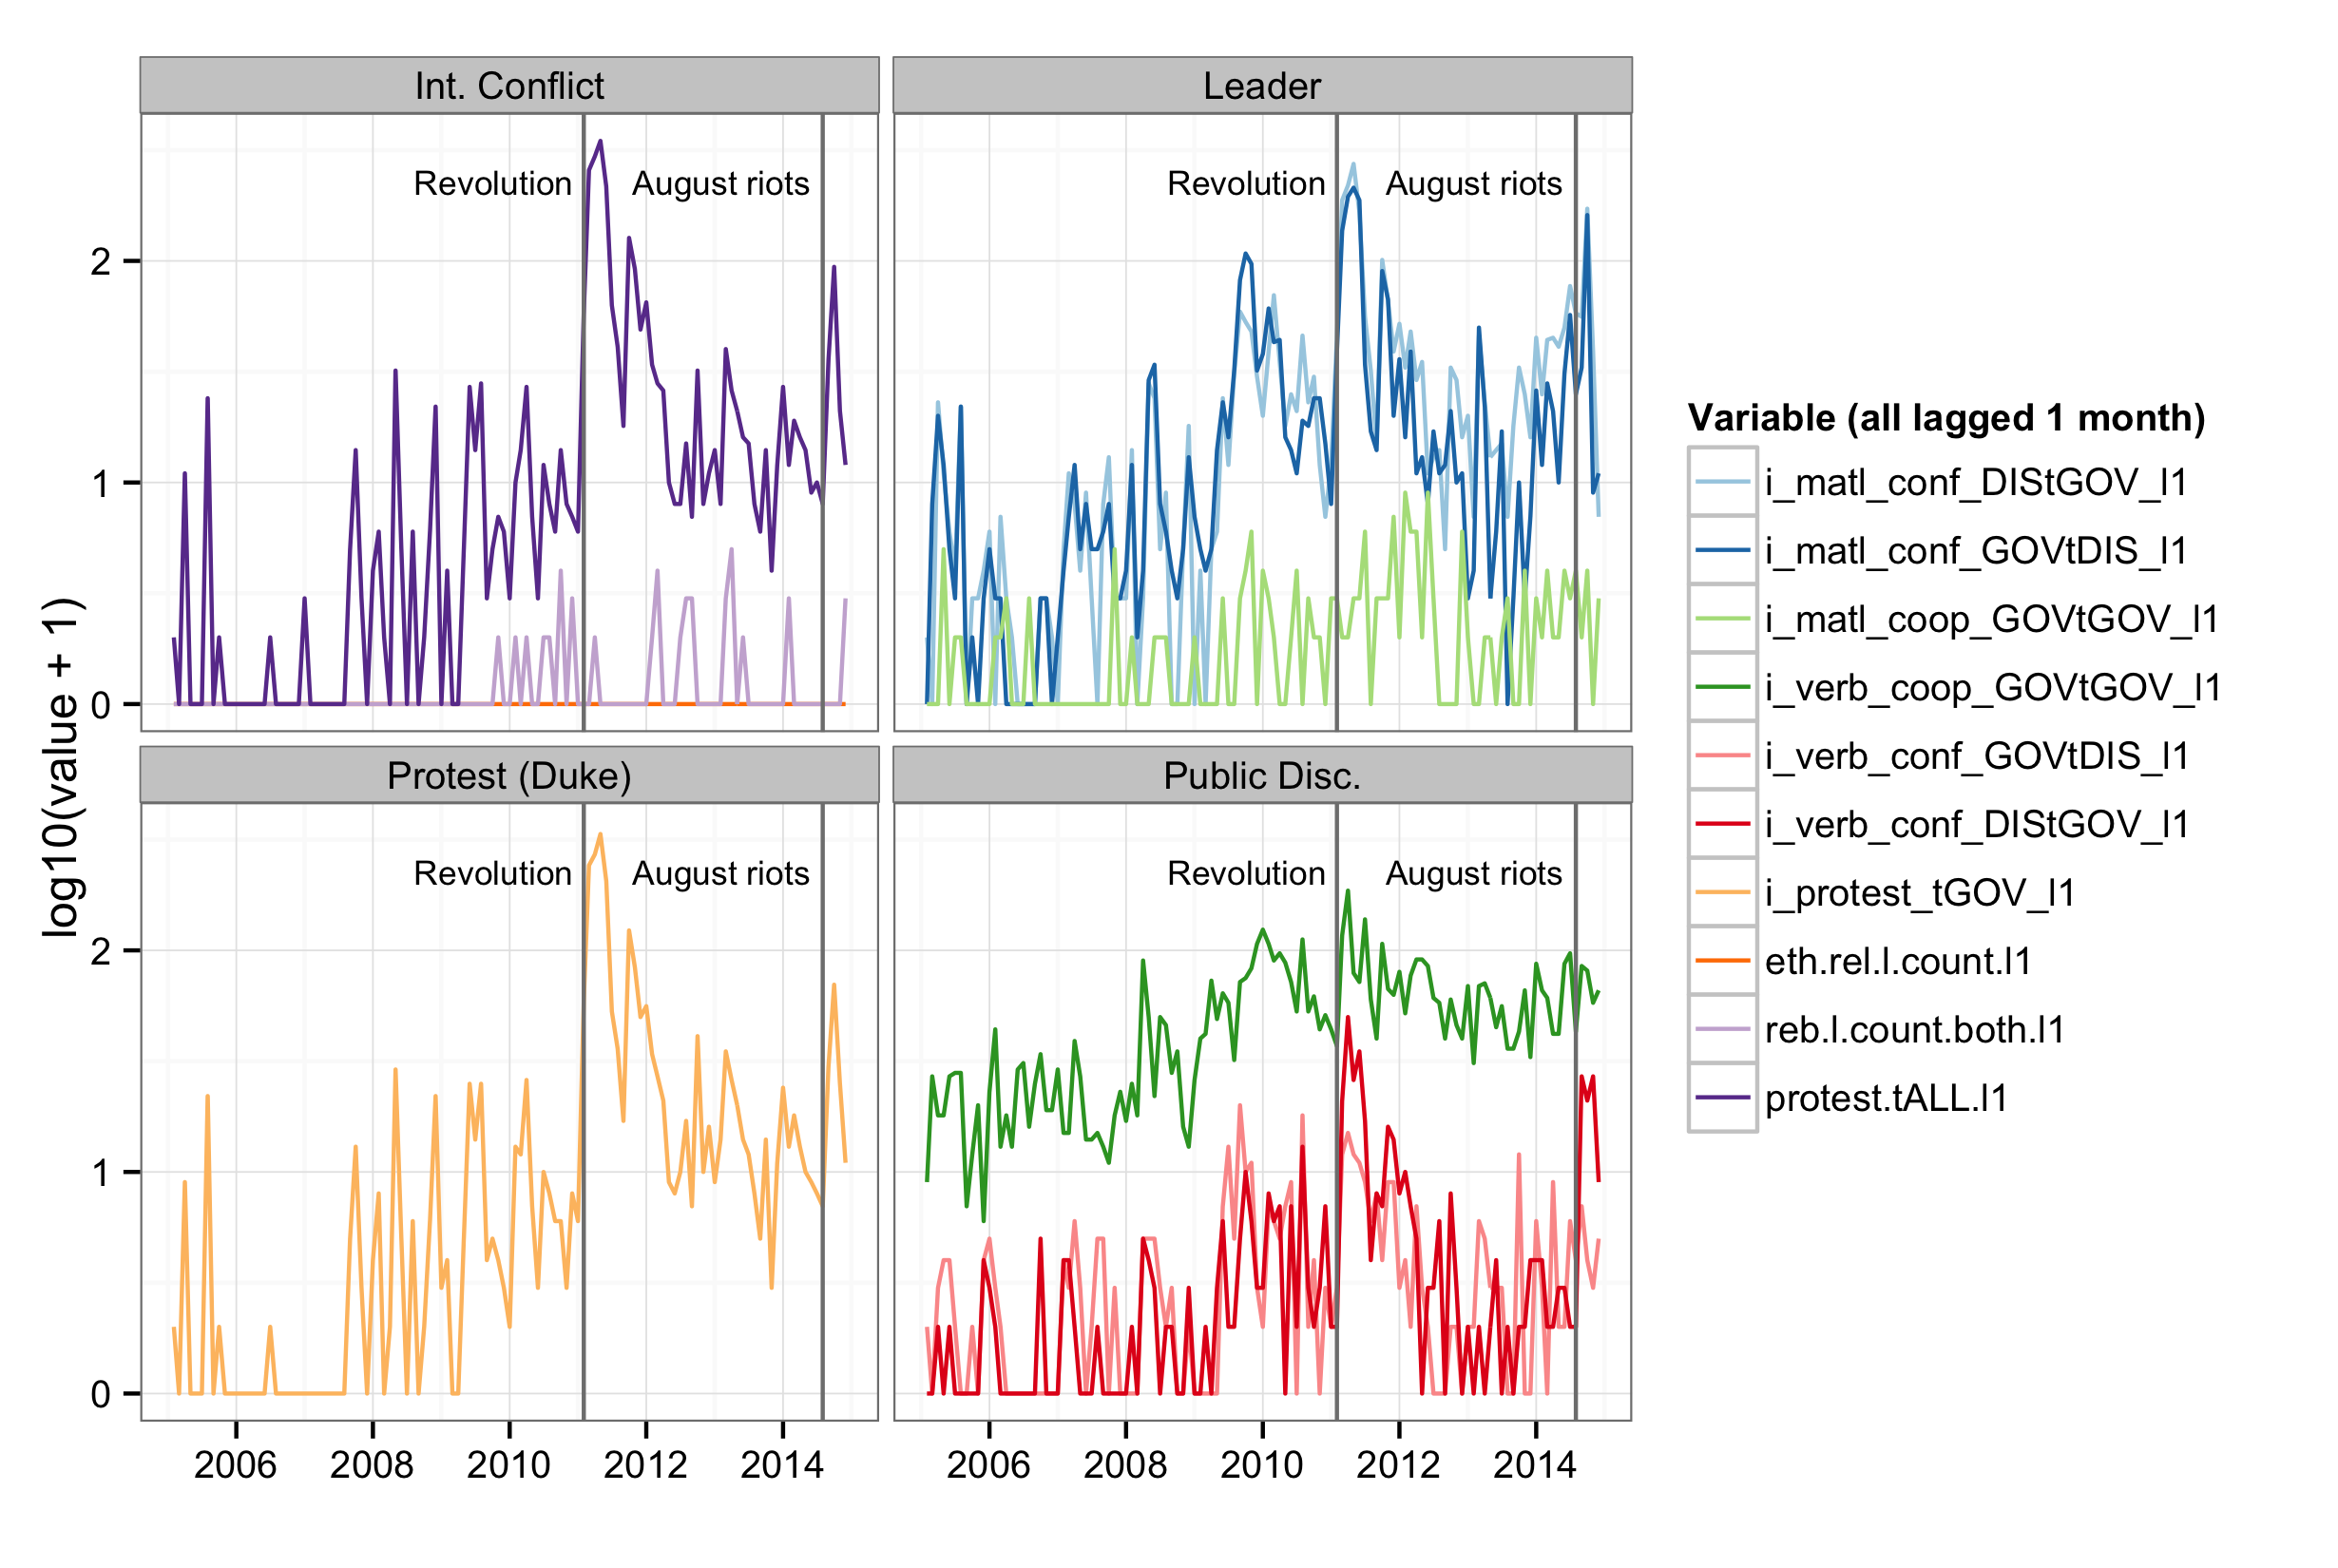
So our forecasts do pick up correctly on at least part of the story. Loosely speaking they are “correct”, in that they match the background narrative of events, up through about September 2014, from which point on the situation slowly deteriorates in a way that our models do not pick up on as much as we would like them to. Quite likely there was a spike in events that would have pushed our forecasts higher had we made them later, i.e. with January or February data, and in the end although Yemen was not included in the tables of forecasts we presented for the first half of 2015, it was still ranked highly and consistently in the top fifth of forecasts.
There is not much here to suggest systematic changes or a new direction in terms of modeling, but that in itself is good to know. Of course we would prefer more accurate models that would predict cases like Yemen higher. Although we are consistently in the high 0.8’s in out-of-sample AUC-ROC, we are just starting to scratch the surface when it comes to precision. But with data as sparse as those we are using, it is also challenging to improve performance in a robust way that survives small changes/updates in the data rather than being a symptom of overfitting.
-
Since we are modeling with country-months, and the vast majority of published work on coups, revolutions, etc. is at the country-year level, we had to improvise our own models. They are loosely based on (well-)known concepts from the conflict literature, but won’t satisfy, and might even upset, people who are engaged in the more traditional, non-forecasting kind of conflict research. But please, feel free to do your own modeling with the 2014 replication data, we would love to incorporate “guest” models that stand on more solid ground. ↩︎
-
The rankings are largely stable from December 2014 on because in our live forecasts we hold back covariates as well, instead using carry forward imputation with limited updating for some variables like leader age, which in most cases still leads to minimal variation in the component and ensemble probabilities. ↩︎
-
…growing awareness, there certainly have been plenty of people talking and writing about this issue over the years. ↩︎
-
We are switching to the ETH version of EPR, which as of May 2015 was updated through 2013. There will still be a missing data problem, but much less severe. ↩︎