Coup forecasts for 2017
Tags:
#Forecasts
This posts provides some background for the coup forecasts article Mike Ward and I published in the Washington Posts’ Monkey Cage.
Coup attempts, even if they fail, as the events in Turkey since July 2016 have shown, can have a major impact on a country. And, as some of the reactions to the Turkey coup attempt have reiterated, they often seem to come as a surprise. We have created coup forecasts for 161 countries for 2017 that should make it more obvious and less surprising where any coup attempts that might happen this year will occur. Aside to presenting those forecasts, this post goes into a little bit more technical detail on how they were created.
First, this project is very much inspired by and in may ways a continuation of Jay Ulfelder’s coup forecasts for 2012-2015 (2012, 2013, 2014, 2015). It also draws on previous work Mike Ward, Cassy Dorff, and I have done on forecasting irregular leadership changes, which include coups, but also other mechanisms of sudden leader change.
Forecasts
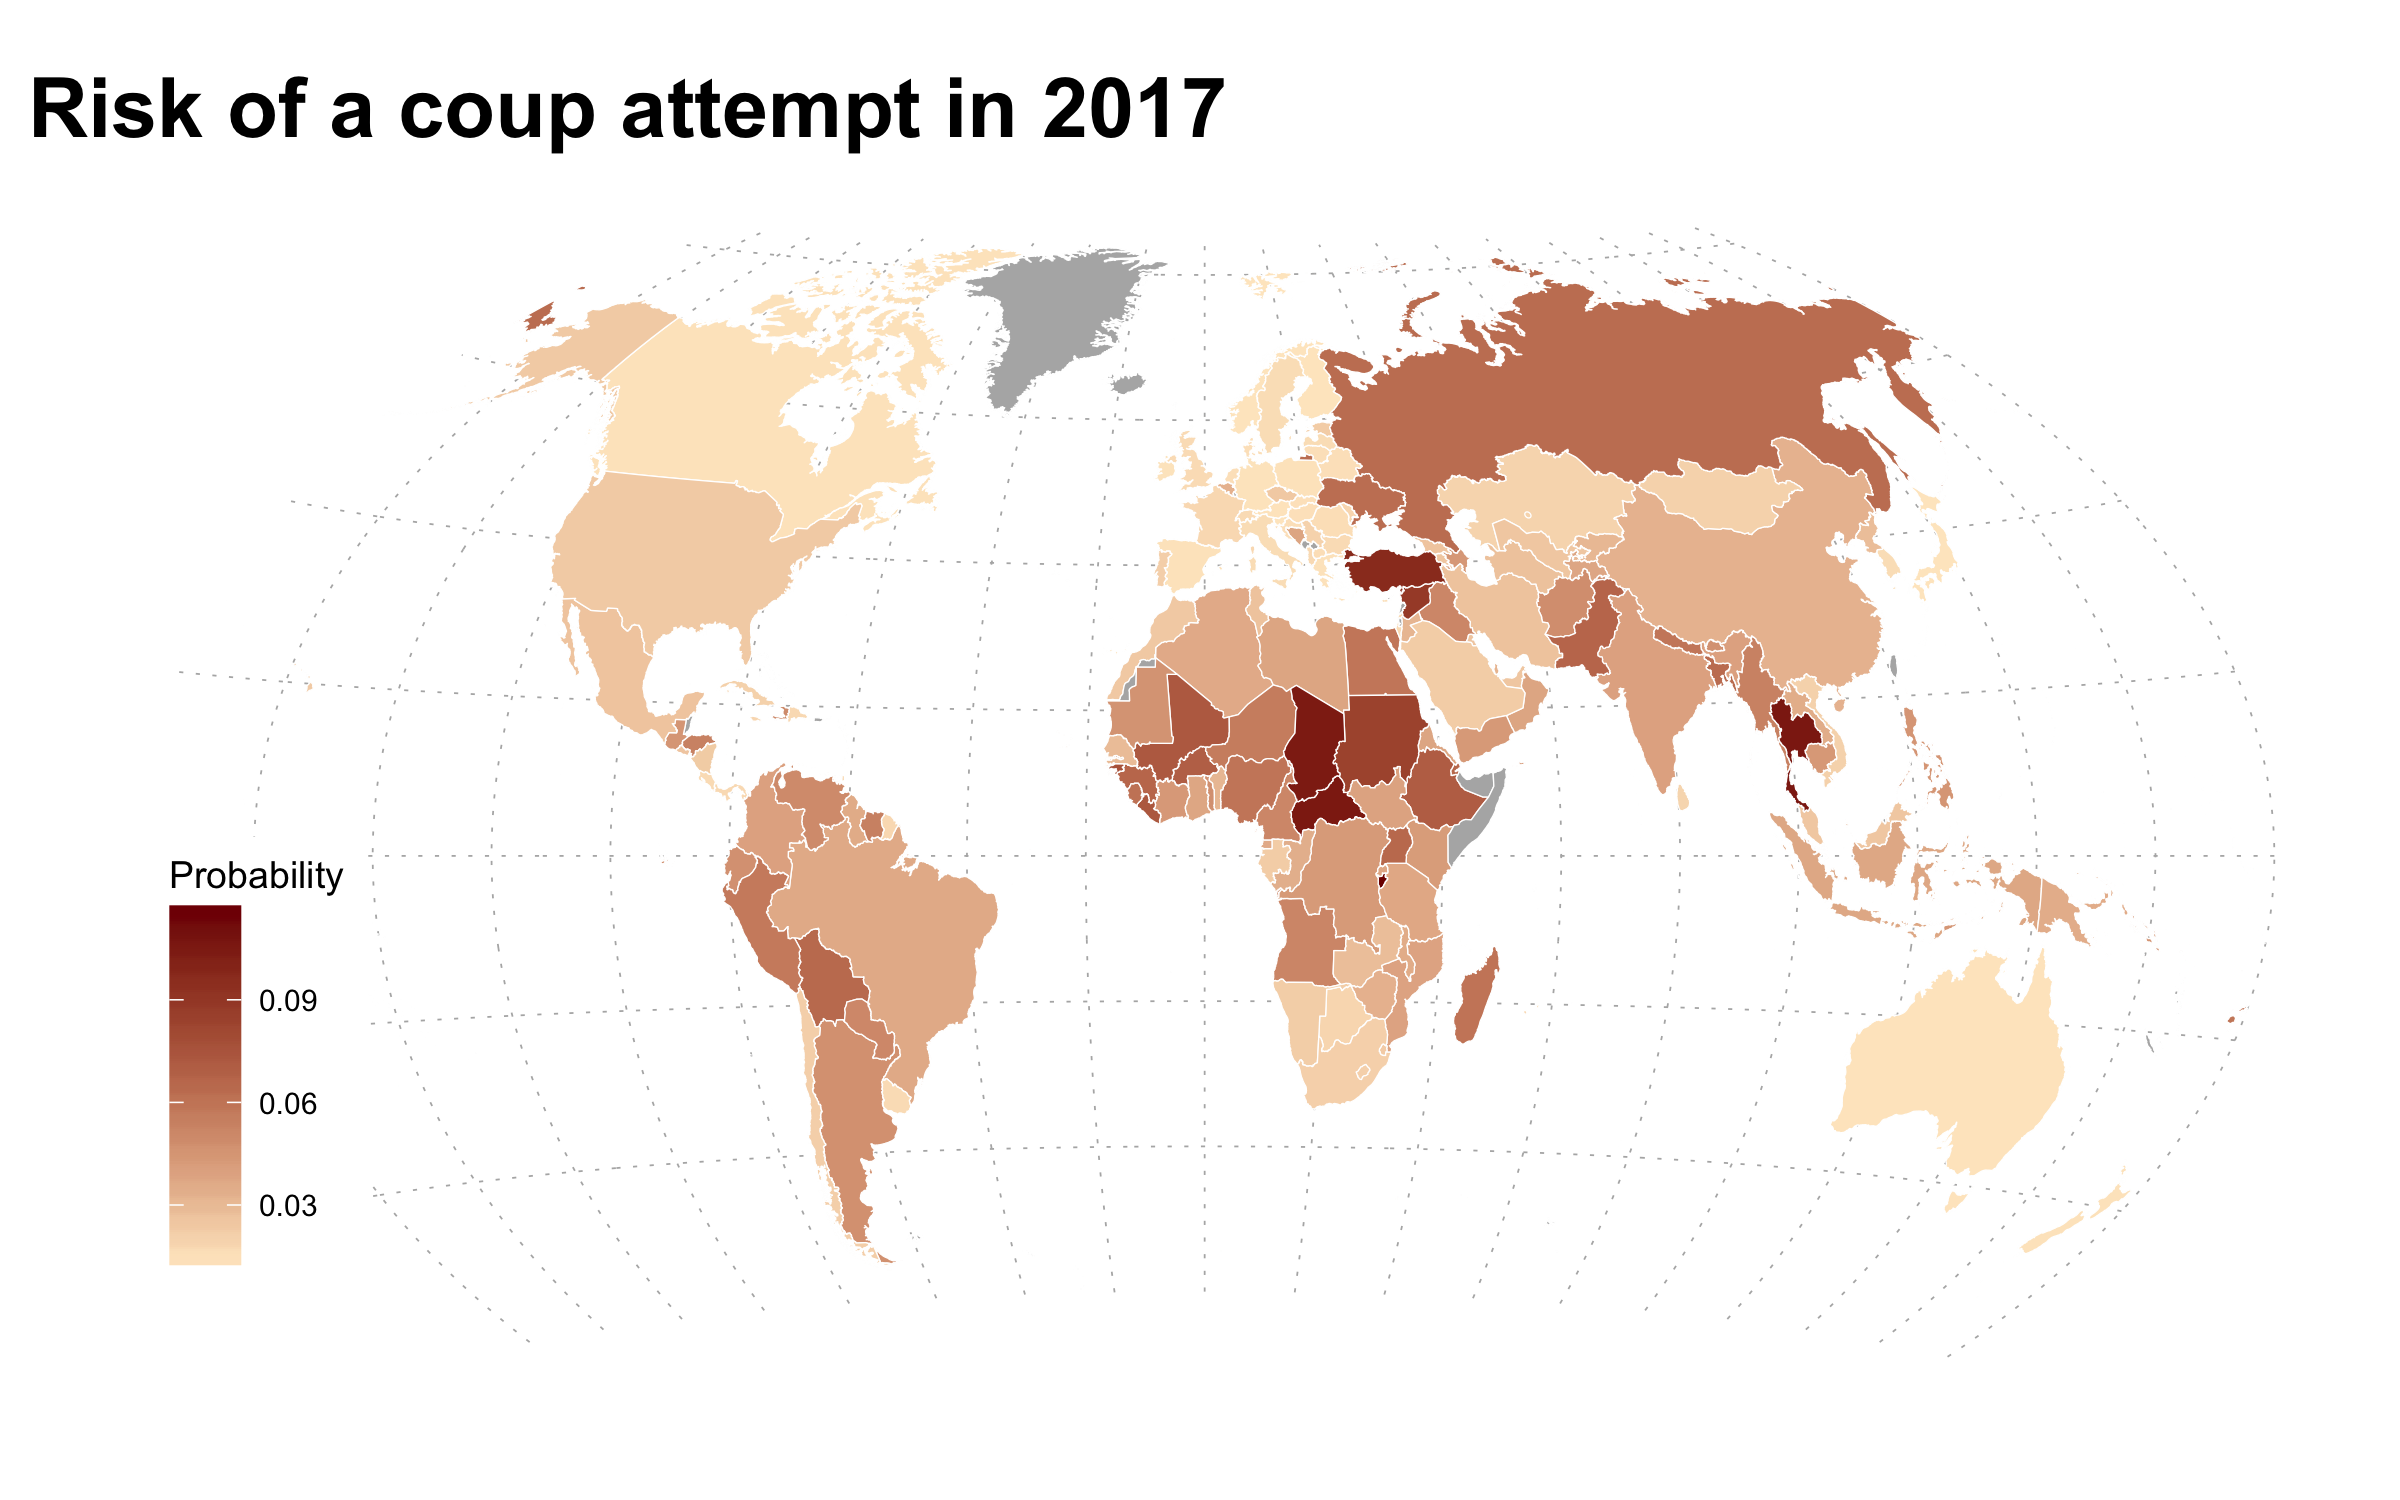
The map above shows the risk of a coup attempt, whether successful or not, for 2017. The risk is created by combining separate forecasts for the risk of a successful coup, like in Thailand in 2014, or failed coupt attempt, like in Turkey this year. The underlying data on coups come from Powell and Thyne1, who define coup attempts as “illegal and overt attempts by the military or other elites within the state apparatus to unseat the sitting executive”. The table below shows all three components–the risk of a coup attempt, and the underlying risk of a successful coup or failed attempt–for the 30 countries with the highest risk of a coup attempt. You can find a complete list of the forecasts here.
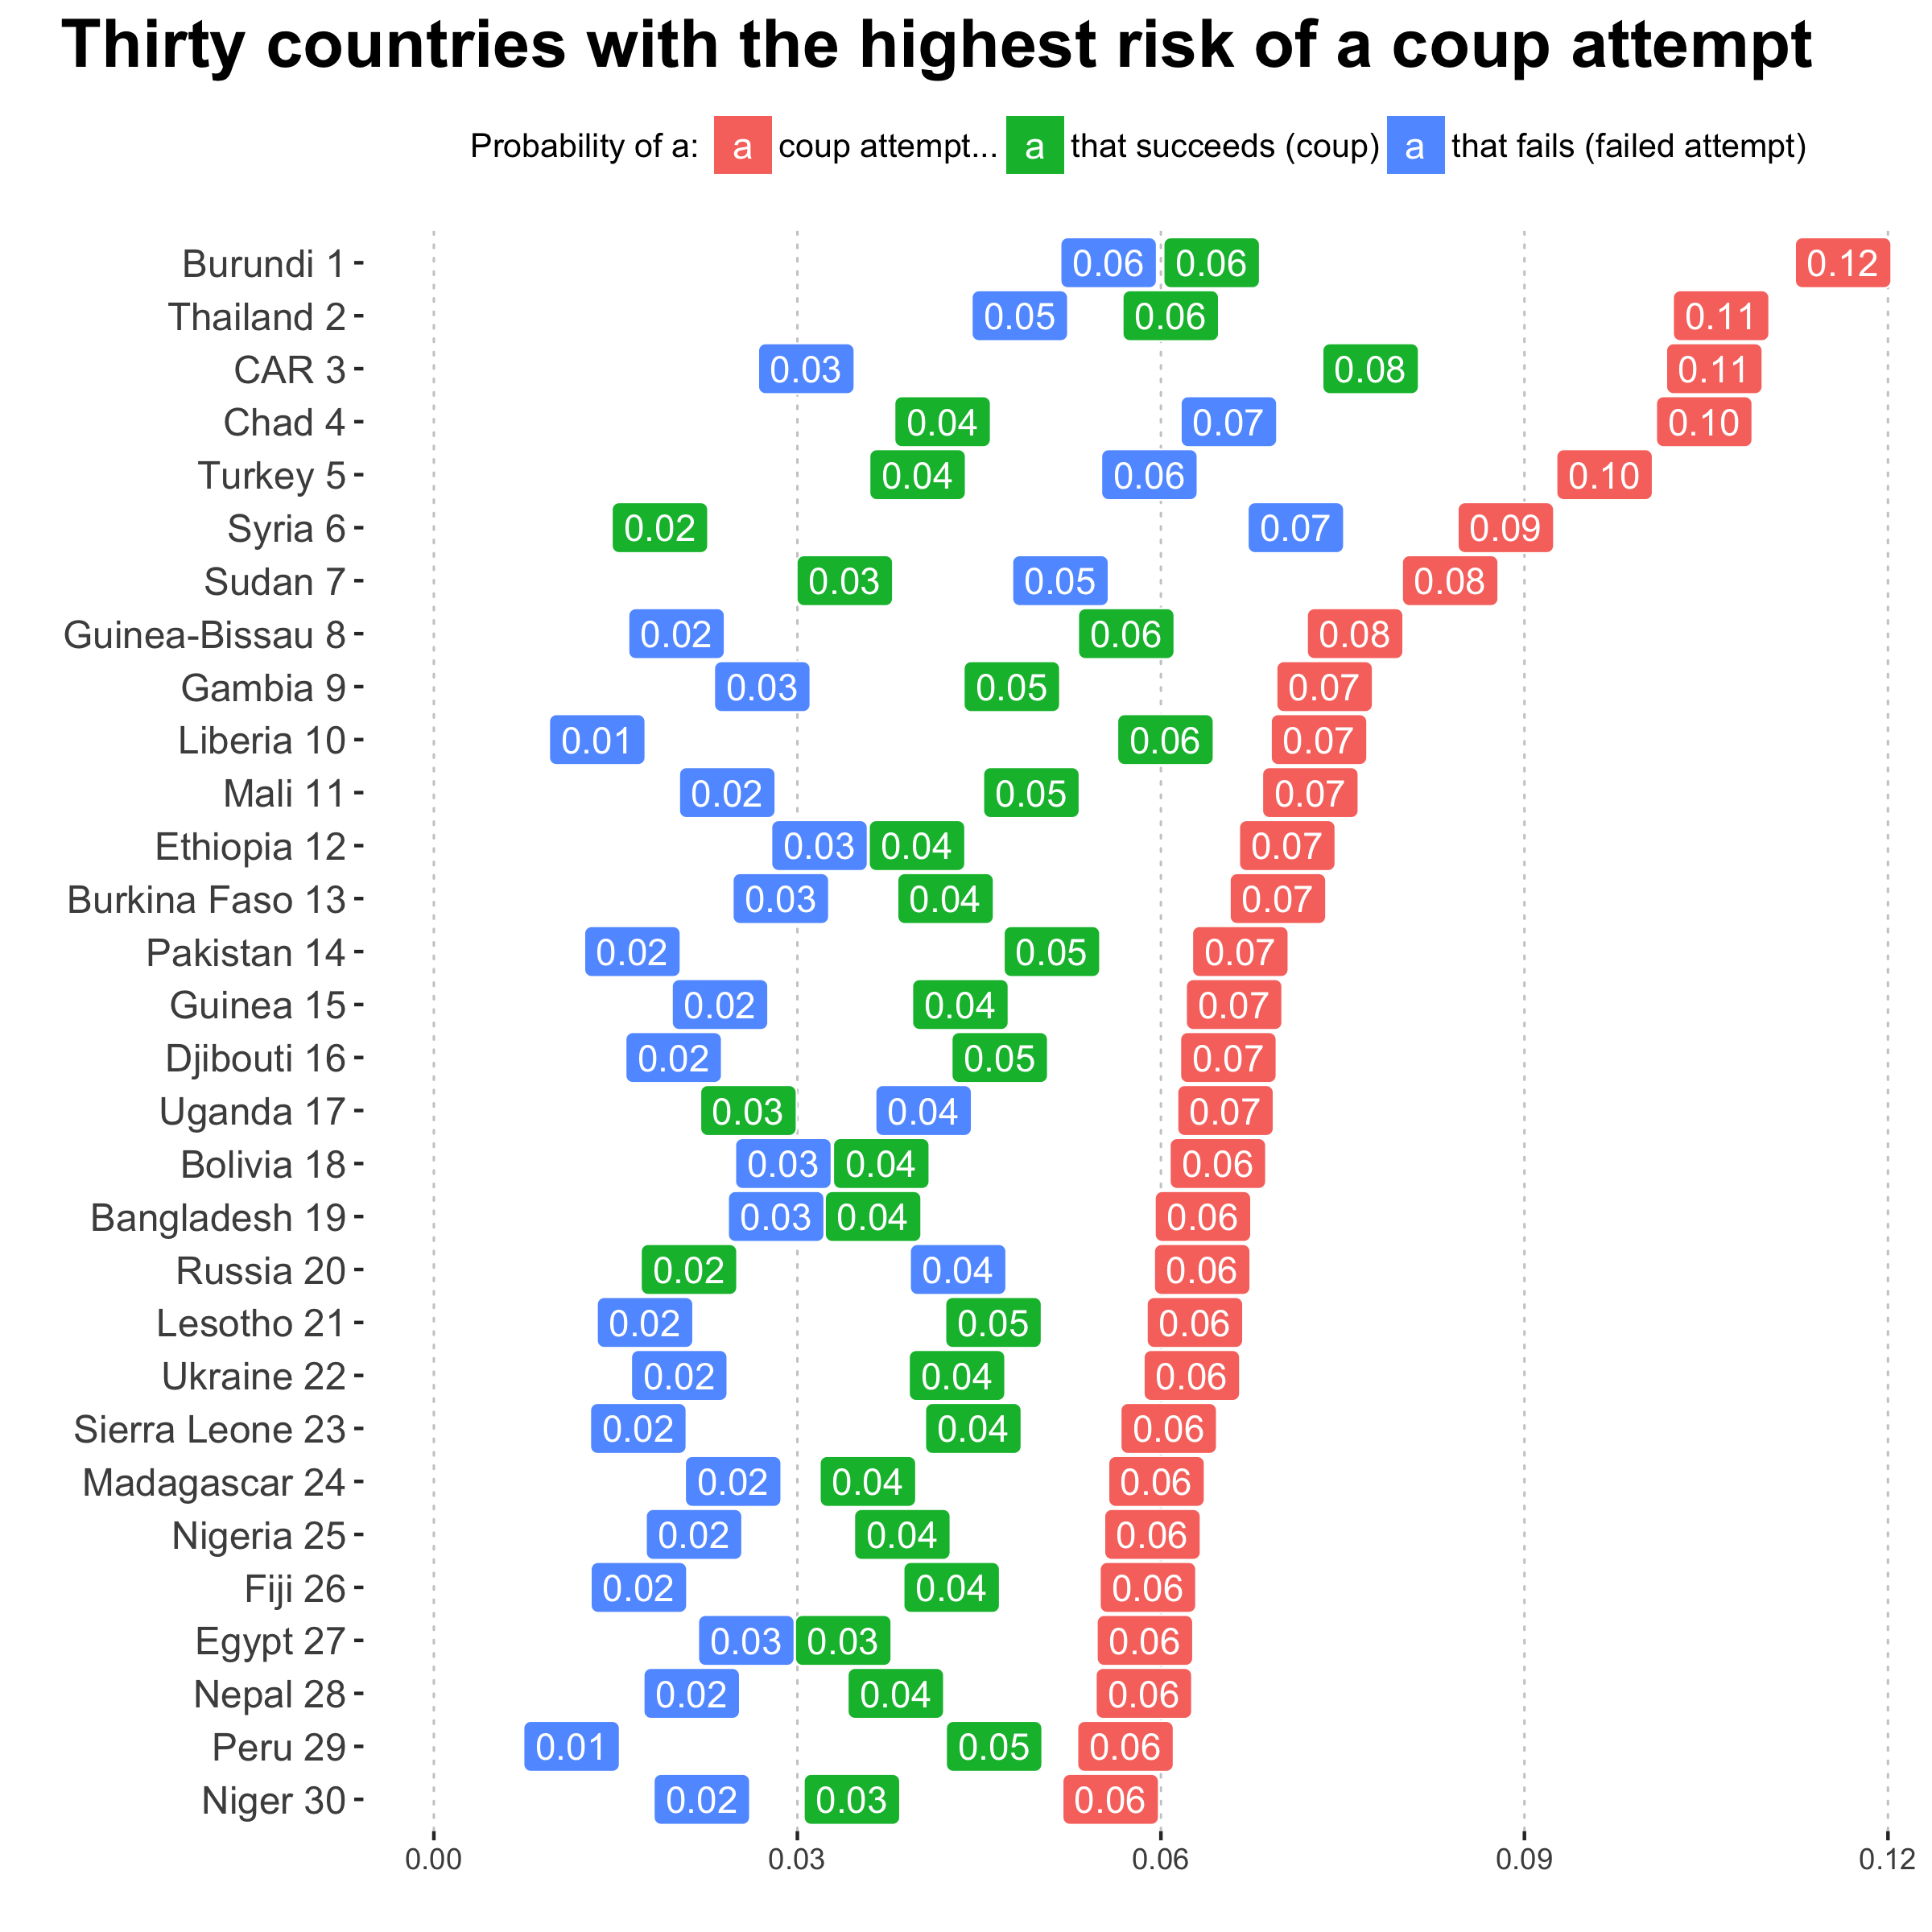
There aren’t any real surprises in the list of high risk countries. A cursory review shows recent episodes of instability for the couple that we checked. It is also true that generally, countries that have a history of coups or that have had recent coup attempts, like Turkey or Ukraine2, have a higher risk. A few worth highlighting, given current events, are Syria, Russia, and the US. Syria has a estimated 9% chance of a coup attempt, and Russia 6%, placing them in the top 10 and top 20 respectively. And, in both we estimate that should a coup attempt occur, it is much more likely to fail than to succeed. In Russia the odds are 2 to 1 for failure, and in Syria about 4 to 1.
Despite the worries of a Trump presidency, the forecast for the US is much lower, with 2%. That puts it at rank 103 out of 161, much higher than almost all other developed democracies. This is because some of the models pick up on infant mortality, a measure on which the US falls behind compared to other wealthy democracies. But 2% and 103rd out of 161 are still not a high risk overall. On the other hand, it is worth pointing out that our models don’t have a “Trump” dummy among their covariates. They are rather based on a number of structural factors like regime type and various economic and societal measures, and by which the US like all wealthy democracies is at a low risk for coup attemps. Arguably it is exactly the potential idiosyncracies and breaks with American democratic traditions that have some observers worried about the prospect of democratic stability in the US, but this is not something we can easily account for, by definition.
Models and accuracy
The way we created the forecasts is somewhat more complex than a single regression model, but the added complexity brings benefits that are worth it to us. Namely, these are the steps to create the final forecasts for any coup attempt, and whether it is likely to succeed or fail:
- Estimate lasso regression and random forest models of the probability of a successful coup and failed coup attempt, making a total of four models using data on past coups from 1960 to 2006.
- Create an ensemble prediction for failed attempts and successful coups by averaging the predictions from the two models for each outcome.
- Calculate the probability of a coup attempt, regardless of whether it fails or succeeds, using the probability rule for disjunction, i.e. as the probability that there will be either a successful or failed coup attempt, or both.
It is easier to discuss the justification for this process by going through several parts, one at a time:
First, why lasso and random forests, rather than a simpler model with an explicit specifcation of covariates along the lines of “coups are a function of wealth, regime type, infantly mortality, and some other limited set of factors”? Both lasso regression and random forest are plug and play in that you can throw a large number of potential covariates at them and they will perform both feature selection and estimate a model that can generate predictions for new cases. This was a time-saving measure, but doesn’t mean other models cannot be incorporated.
Second, why use ensembles for each outcome? Ensembles are often more accurate and stable than their individual components. In this case, there was not much of a difference between the averaged predictions and the individual predictions from the lasso and random forest models. But keeping the framework makes it easier to add more models, maybe including some based on existing research on coups, down the road. On a related matter, there are different ways to construct ensembles. In this case a simple average was the quickest solution, but if the number of models expands in the future an ensemble constructed using EBMA or one of the other methods for stacking/ensemble-ing models might be better.
Why not model coup attempts directly? Modeling coup attempts directly with it’s own set of lasso regression and random forest models and corresponding ensemble is more accurate than the disjunction predictions for coup attempts. But it becomes harder to say whether a coup attempt is likely to succeed or fail. We still have the predictinos for failed and successful coups, but since the underlying models are estimated separately, the probabilities for the three possible outcomes do not add up, so to say, the way the disjunction predictions do. Specifically, P(any attempt) $\neq$ P(coup) OR P(failed attempt) anymore. This might be confusing, and thus for the sake of presentation and interpretability the disjoint approach is prefereable.3
Accuracy
The table below has two measures of accuracy for the base model, ensemble, and disjunction predictions, the area under the ROC curve (AUC-ROC) and the similar area under the precision-recall curve (AUC-PR). The AUC-ROC is related to the tradeoff between recall (Of the coup attemps that happened, how many did we predict?) and the false positive rate (How often do we predict a coup attempt when there wasn’t one?). The AUC-PR looks at the tradeoff between recall and precision (When we said there would be a coup attempt, how often was there?) instead. It’s a subtle difference and the AUC-ROC is used much more common in political science, but less than 4% of country-years experienced one or more coup attempts and for rare events like this AUC-PR is also a good measure to look at. The training fit is the average fit for repeated cross-validation with 10 folds repeated 10 times, using data up to 2006. The test fit is for predictions from 2007 to 2016.
| Outcome | Model | Train ROC | Train PR | Test ROC | Test PR |
|---|---|---|---|---|---|
| Attempt | Disjunction | 0.806 | 0.052 | ||
| Coup | Ensemble | 0.732 | 0.038 | ||
| Coup | Lasso | 0.801 | 0.088 | 0.766 | 0.020 |
| Coup | RF | 0.808 | 0.083 | 0.725 | 0.037 |
| Failed attempt | Ensemble | 0.836 | 0.030 | ||
| Failed attempt | Lasso | 0.772 | 0.090 | 0.842 | 0.050 |
| Failed attempt | RF | 0.782 | 0.086 | 0.785 | 0.023 |
Both accuracy measures can range from 0 to 1, where higher is better. For the AUC-ROC, anything less than 0.5 is terrible. The overall AUC-ROC is around 0.8, which seems to be the 80% solution in a variety of conflict forecasting applications (Phil Schrodt pointed this out somewhere?). Maybe adding some artisan models to the ensembles would help a bit here. The biggest problem, not surprising given the input covariates, is that the precision of the predictions is not very high. Even if the models do a good job at ranking the small number of country-years with coup attempts higher than the majority of country-years without coup attempts, most of the models’ positive predictions (“expect a coup here”) are still non-events. But still, the results are decent overall.
There are no training fit values for the ensemble and disjunction models because the cross-validation scheme we use from caret is based on random partitioning, meaning the sets of predictions are not comparable, and thus not averageable accross models. Without some extra work.4 However, since there is no fitting or parameter tuning involved in averaging or disjointing, the test fit should still be a valid indication of out-of-sample, true forecast performance.
There are three important caveats for using these accuracy values to set expectations for how accurate the 2017 forecasts are going to be. Coup attemps are becoming less frequent over time, which is part of the reason that accuracy is higher in the training than test period. Second, the test period forecasts are not generated exactly the same way as the 2017 forecasts. We extrapolate some data values for 2016/2017, like Polity regime types, by assuming they will stay as they were last year. That could introduce some variation. Lastly, the numbers above are average fit measures computed on the basis of decades of data. There is variation in the accuracy for any single year, depending in part on the actual number of coup attempts in that year.
Data
The data range from 1960 to 2017. The data for 2017 are really values for 2016–most covariates are lagged 1 year? We can update some covariates, like how many years a current leader has been in power, by assuming things will stay the same as on December 31st, 2016. We use the Gleditsch and Ward list of independent states as the basis for constructing the country-year data. We count states that existed on December 31st of a year, and also used the last day of the year for capturing things like the sitting leader or regime type.
Covariates
Covariates, factors that might be helpful for predicting coup attempts, came from several different sources:
State characteristics like years since independence, are based on the same Gleditsch and Ward list of states that form the core of the cases (country-years) in the data.
State leader characteristics from Archigos (here or here), like the number of years the current leader has been in power, or whether they entered power themselves in an irregular fashion.
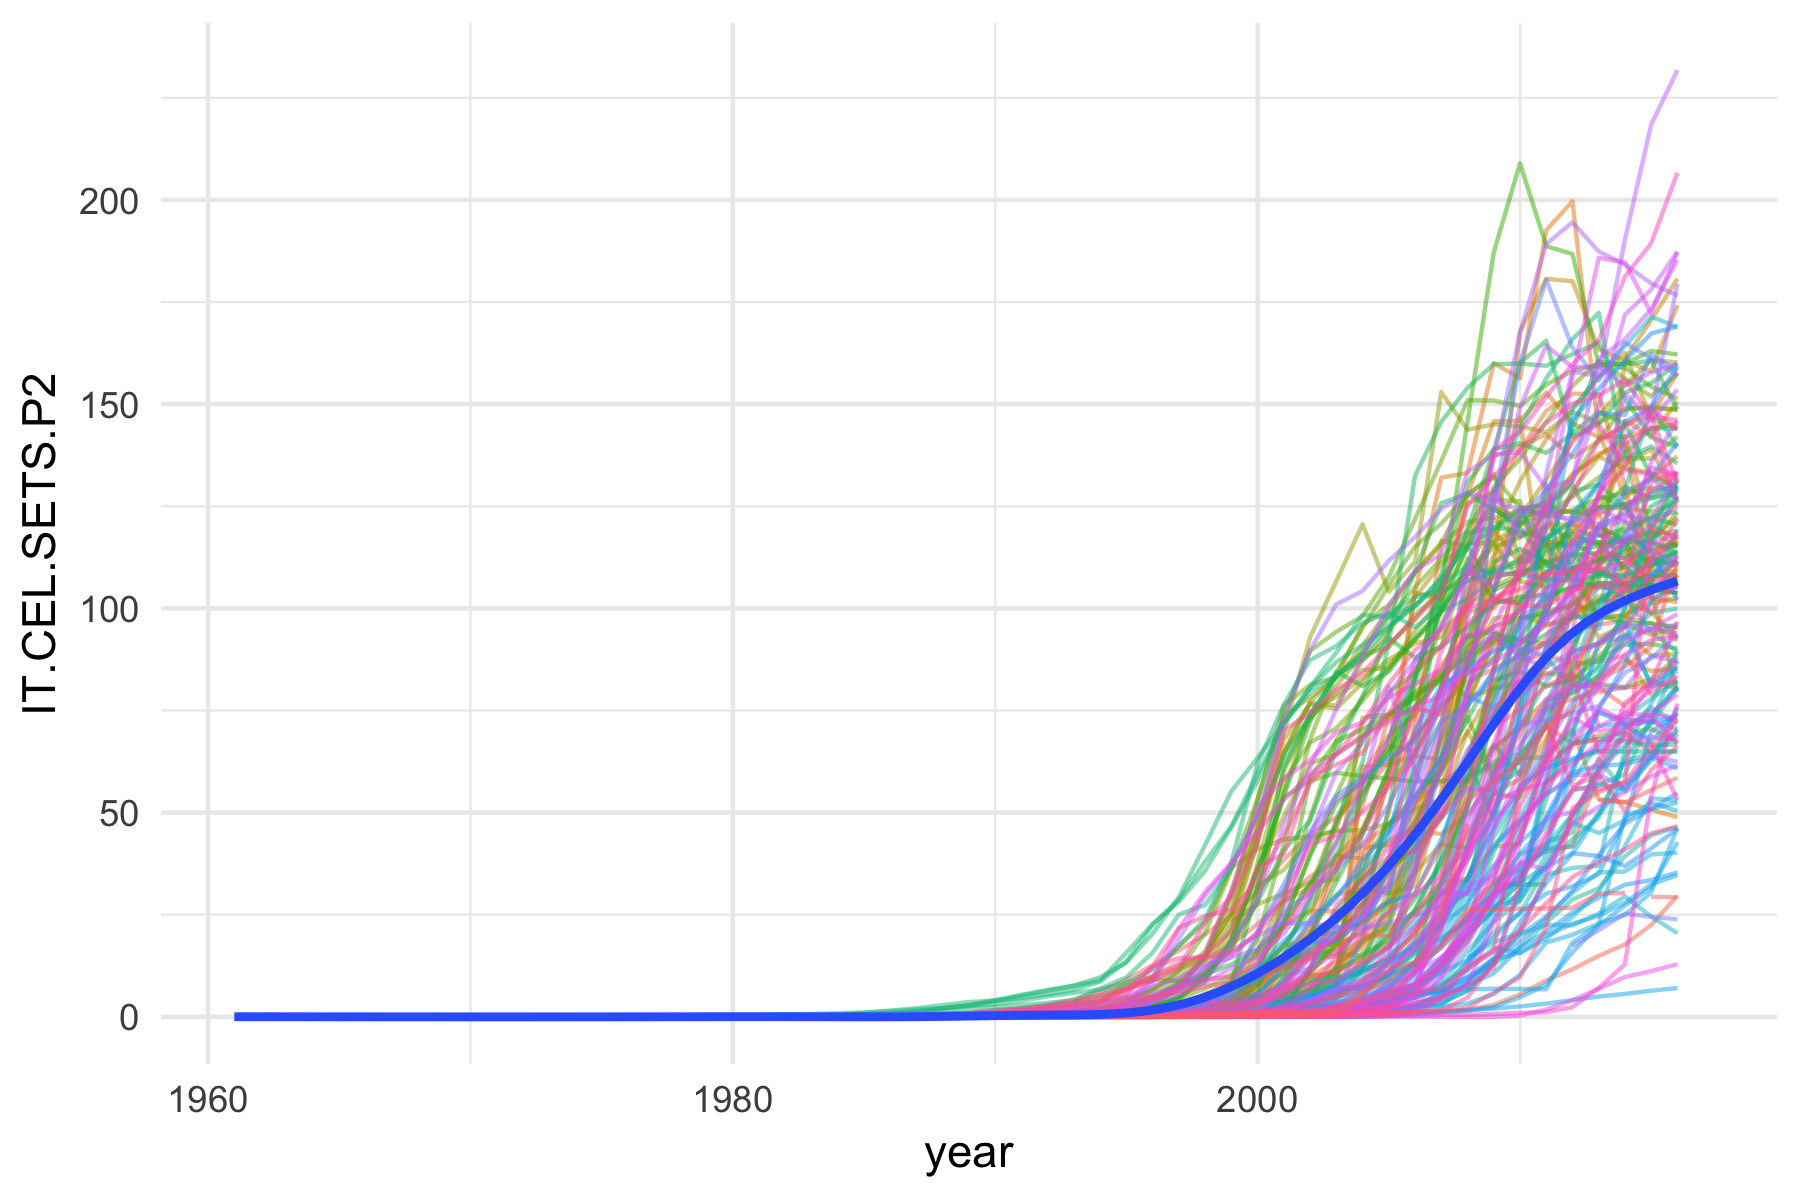
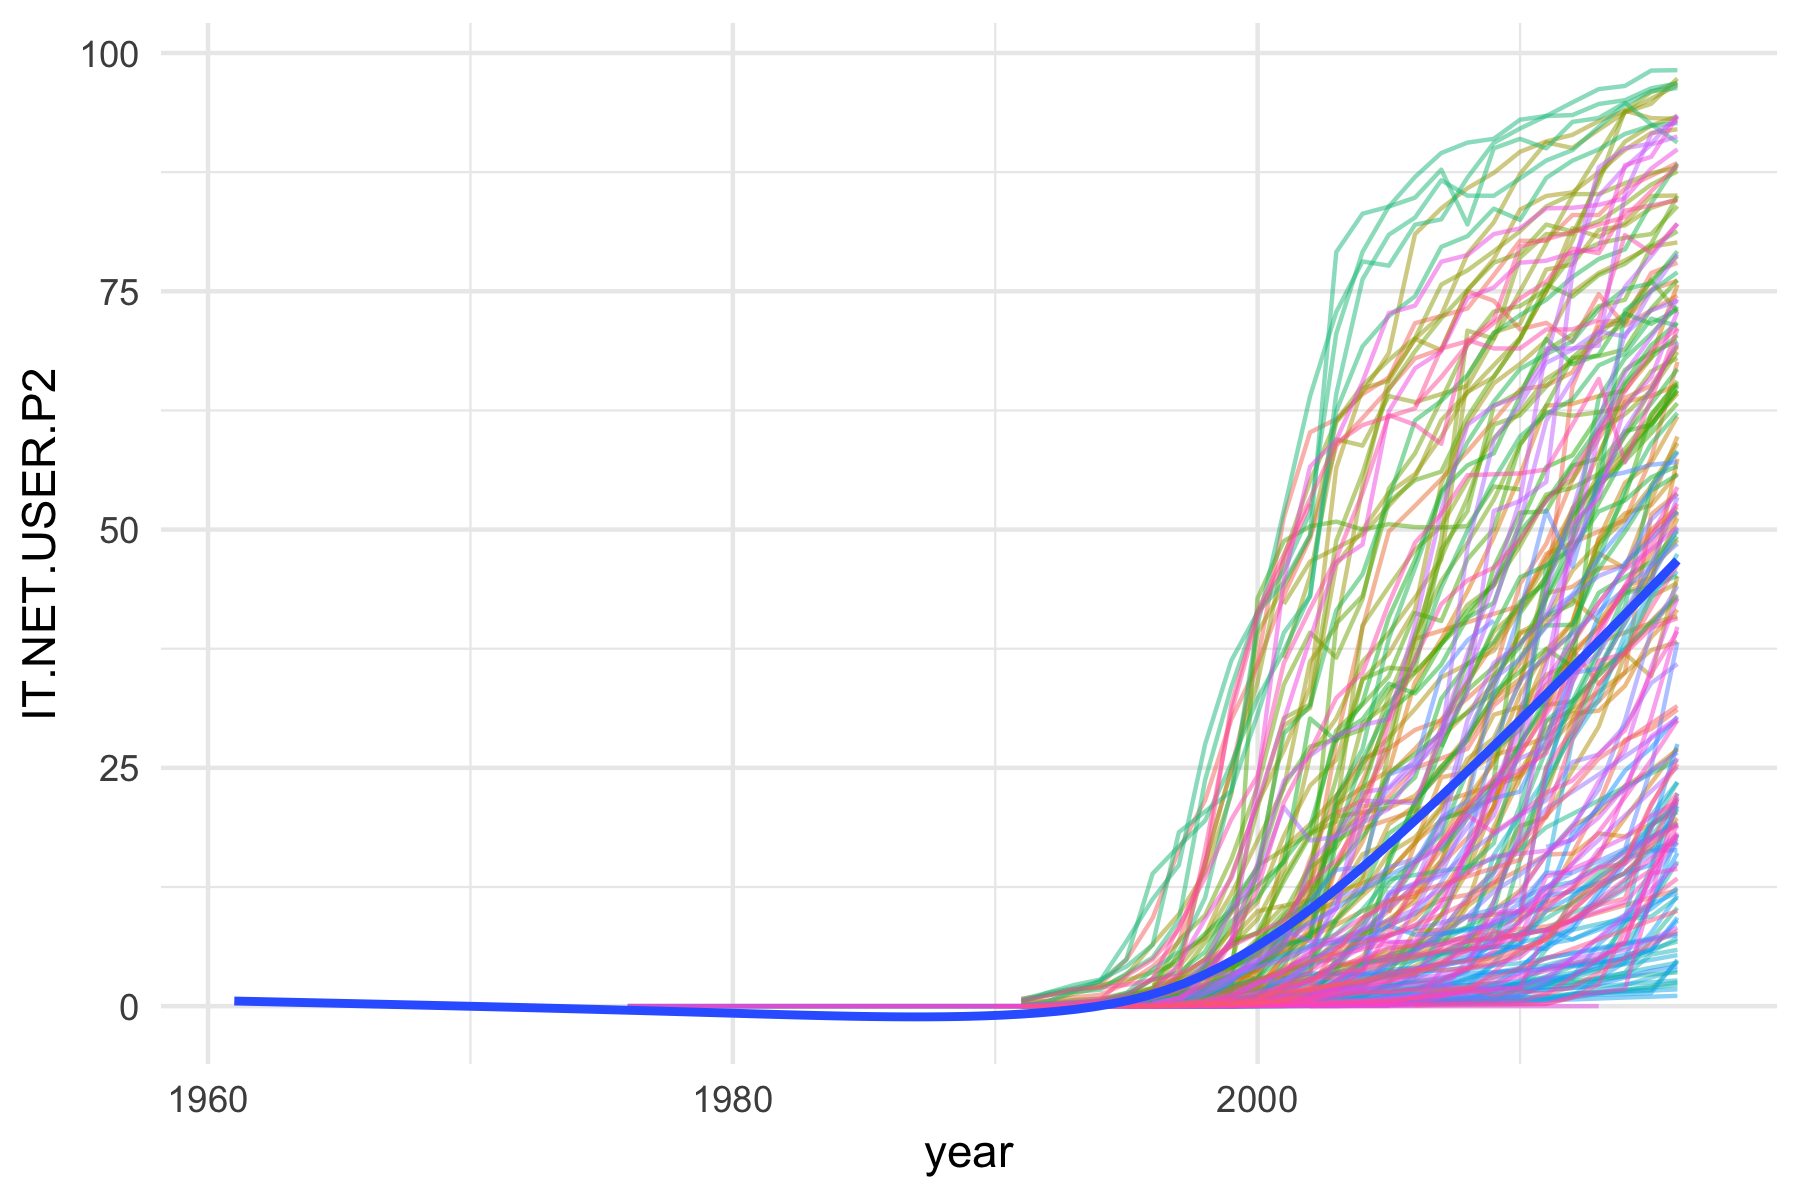
Development related factors like wealth from the World Bank World Development Indicators. GDP, GDP growth, population, infant mortality, but also cell phone and internet usage rates.
The idea to use these originally goes back to the Ward lab’s ICEWS work and later our irregular leadership change work. Coups are in large part a game of setting expectations, creating the perception that the coup has already succeeded. That’s why back in the day you seized the broadcast stations and announced your new junta. And it just so happens that the number of coup attempts started dropping off in the late 1990’s and early 2000’s, when the internet and cell phones started spreading and becoming more common in countries that have experienced many coups in the past. It seems plausible that the decrease in coups may in part have something to do with the decentralization of communication. It becomes harder for a small group of people to dominate the flow of information and create a narrative of coup success. What comes to mind here is for example the way social media in Turkey last July was used to mobilize popular opposition to the coup attempt. And of course Erdogan’s first crucial public communication during the attempt was via video chat on a cell phone. Maybe protests on the other hand are becoming easier to coordinate.
Regime characteristics from Polity. Factors like constraints on the executive, how political competition is regulated, and overall indices of democratic and authoritarian features of a country’s political system.
Global food prices from the FAO. This is a single index of average global food prices. Something more disaggregated, like regional food prices, would be better, but this is the data we could find.
Oil prices from the BP Statistical Review of World Energy.
Prior coup history from the same Powell and Thyne coup data that the outcomes are coded from, for example the number of coup attempts/successful coups/failed attempts in the past 10 years.
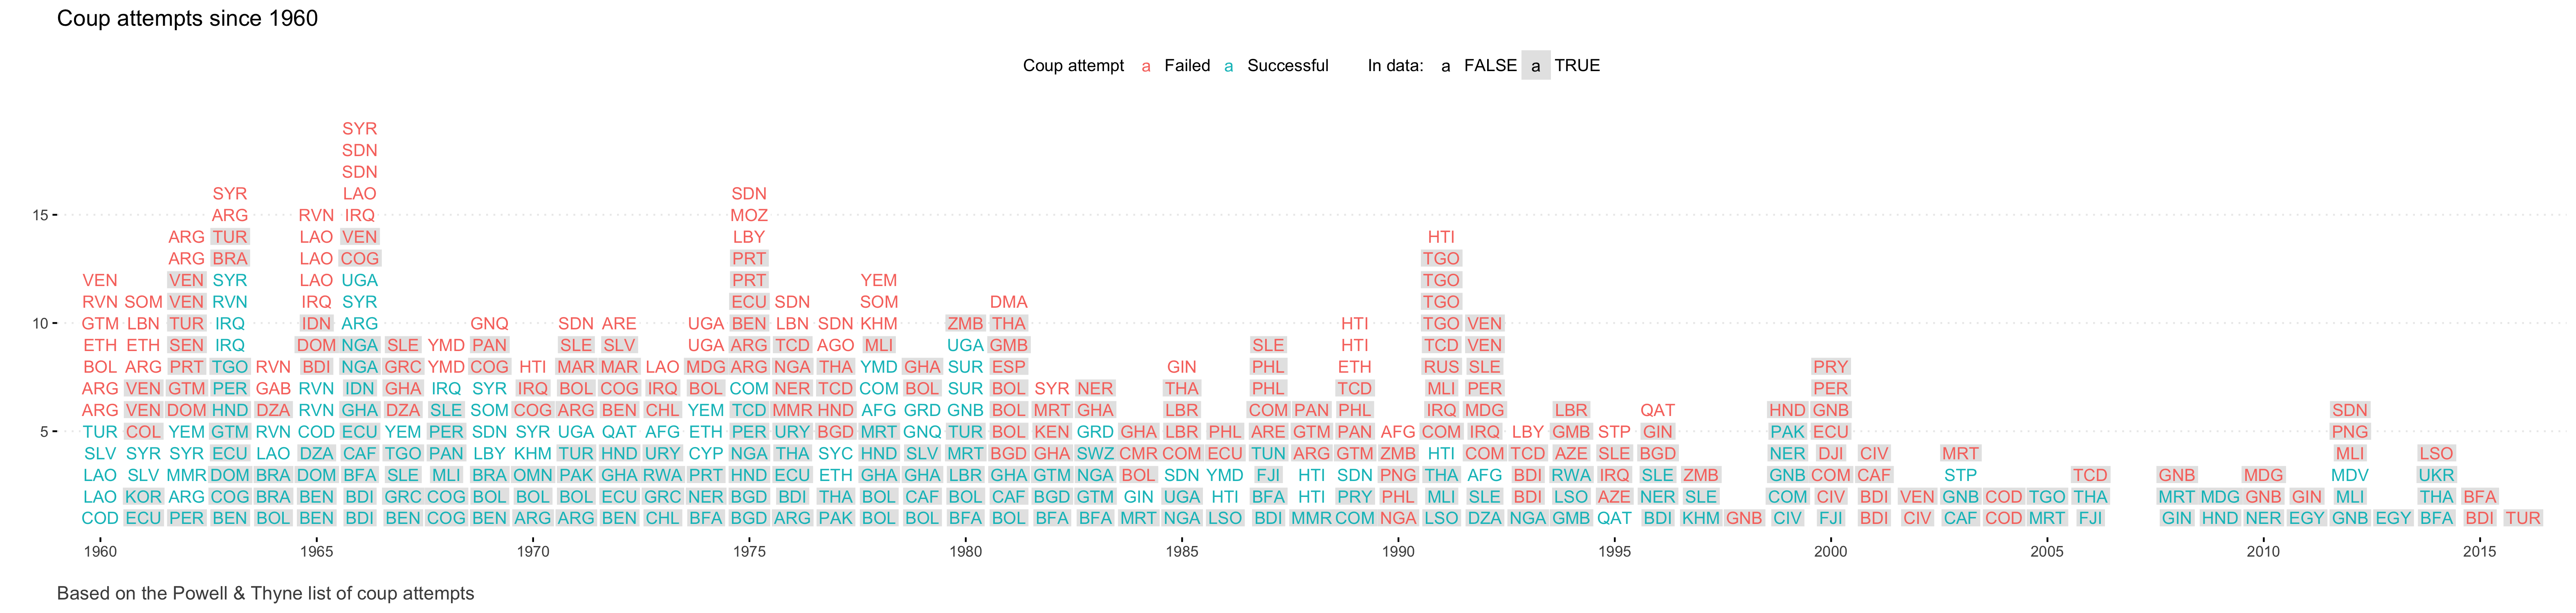
Coups
The Powell and Thyne coup data include the date of the coup attempt, and whether it was successful. There have been a total of 414 coup attempts since 1960, of which about half, 206, have been successful coups. Coups are becoming distinctly less common over time. Over the past 15 years, there have been 2-4 coup attempts per year. In 2016 there was only one coup attempt, the one in Turkey.
Here are by the way also plots of cell phone ownership and internet usage rates per 100.
Missing data
The Gleditsch and Ward list of states, with annual data and counting states in existence on the last day of a year, produces about 9,500 country-years between 1960 and 2016 that we should have. Quite a few of these observations drop out due to missing covariate data, about 30%. The final data used for model training and testing has about 6,700 country-years. There are 195 states (per G&W) in 2016; we have forecasts for 161 states.
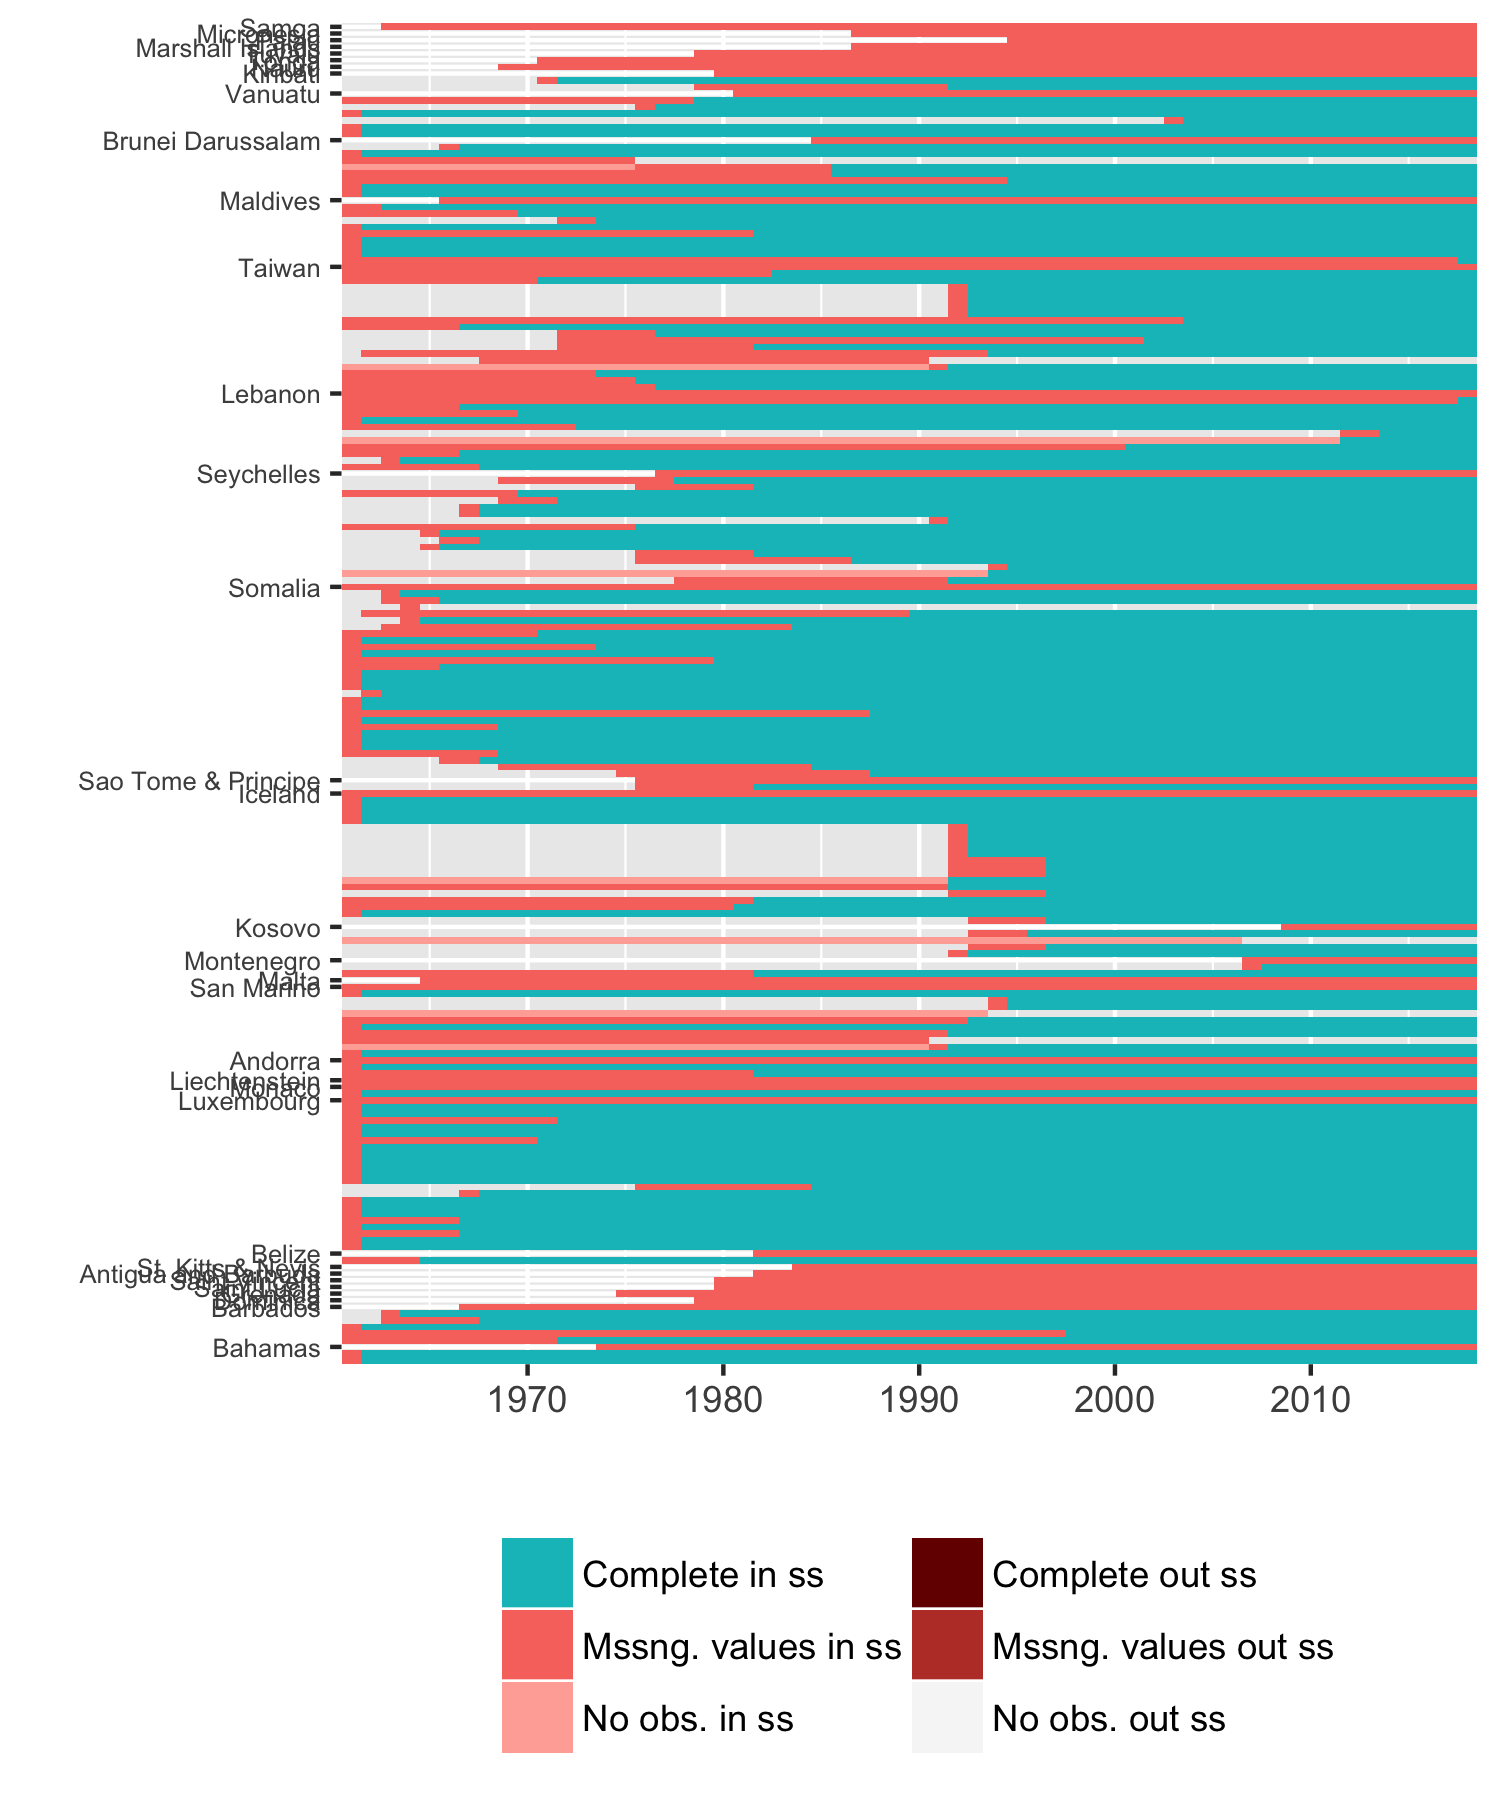
This plot shows missing country-years in the final data. On the x-axis are years, and each row on the y-axis corresponds to a country. We have labelled those that we do not have forecasts for. There are two important patterns in this:
- a lot of the missing values are for countries that are missing completely, like the smaller Pacific island nations at the top of the plot. Generally these are states with a population less than half a million, which is the cutoff criterion for inclusion in some of the data sets we used;
- many of the other missing values are for newly independent former colonies in the 1960’s and 1970’s, which are exactly the kinds of places where you might expect a military coup. That is suboptimal.
About 30% of the coup attempts since 1960 also drop out of the final data. The table below summarizes how many are missing by the reason they are missing from the final data. The largest portion by far are missing because of missing values in the World Bank World Development Indicators. Mostly this is due to missing GDP per capita values.
A couple of coups are missing because they occured in countries, like Ethiopia that at some point since 1960 fragment (Eritrea). We dropped those countries from the data because the WDI indicators like GDP are misleading since they have been back-coded to capture only the currently existing fraction.
In a small handful of instances (3), coup attempts drop out of the data because they occurred in the first calendar year of a country’s existence. Because many variables are lagged one year, the first year for an independent country is missing from the final data.
| Reason | Attempts | ATT% | Failed attempts | FA% | Coups | CP% |
|---|---|---|---|---|---|---|
| In data | 306 | 68.76 | 157 | 70.40 | 149 | 67.12 |
| Missing data in WDI | 101 | 22.70 | 47 | 21.08 | 54 | 24.32 |
| Dropped because country later fragments | 18 | 4.04 | 10 | 4.48 | 8 | 3.60 |
| Missing data in WDI, ACD | 10 | 2.25 | 6 | 2.69 | 4 | 1.80 |
| First year of independence | 3 | 0.67 | 1 | 0.45 | 2 | 0.90 |
| Missing data in Polity, Archigos | 3 | 0.67 | 1 | 0.45 | 2 | 0.90 |
| Missing data in Polity, Archigos, WDI | 3 | 0.67 | 1 | 0.45 | 2 | 0.90 |
| Missing data in Polity | 1 | 0.22 | 0 | 0.00 | 1 | 0.45 |
We did not use comprehensive multiple imputation and instead rather did variable-specific interpolations and extrapolations. These are limited in that we only attempted to replace missing values if they occured in a small number in a data series. And they are variable specific in the sense that we examined the series for a variable to determine how to impute, e.g. logistic growth models fit the observed evolution of internet and cell phone usage rates well, while linear growth works well for most countries for GDP and population. If a country was missing many or all values for a variable, we kept it missing.
Multiple imputation often ends up imputing entire missing countries or years, something we strove to avoid doing, and in general it can be problematic for non-independent, structured data. For example, while the imputed values may reflect the general distribution of non-missing values and cross-correlations with other variables, and thus be fine for statistical estimation, multiple imputation can produce values within a single data series that obvioulsy seem wrong and which are a bad basis for case-specific predictions. A large jump in a small gap of data, those sorts of things. We intentionally only imputed values that based on visual examination appear valid and plausible.
Why did we not include…?
There are a couple of factors that normally show up in models of coups or coup attempts but that we did not use to generate our forecasts. The most notable ones are variables related to the time from the last or to the next future election, and various variables related to the structure and size of the military, like number of personnel, size of the budget, spending per soldier, and variables derived from the number of competing security organizations.
The problem with statistics regarding the military is that there are bigger than usual problems with missing values, and that one would have to combine several different sources to get coverage from 1960 to the present. Jay Ulfelder has has some more details that also apply here, and also brings up the good point that some of the things we really would want to know about the military, like infighting, is hard to measure.
Including elections is also complicated by the potential need to combine data from several sources. There are also two additional practical problems. One is what to do with countries that don’t hold regular national elections, like North Korea or Saudi Arabia. These are often the countries we are most interested in predicting coup risk for.
The second problem is that some elections are the result of preceding coups. Ghana, for example, experienced a coup in 1966 that overthrew an authoritarian leader, and which led to elections in 1969; these were followed by another coup in 1972.5 That has implications for how to construct variables dervied from elections. For example, while it may be that some coups are staged to pre-empt upcoming elections, it would be problematic to include a counter of the time to the next elections since it would also count towards some elections that were the result of a coup.6
Parting thoughts
Some people will find the lack of depth in these forecasts disappointing. It is true that we cannot say much about why the risk for some countries is higher than for others. We can and have looked at other reports about events in those countries and can speculate on that basis, just like anyone else, but we have explicitly avoided trying to make causal statements derived from the models that we use to forecast. That is not to say one couldn’t work towards that goal by adopting one of the many models in the literature on coups and coup attempts that do try to evaluate causal arguments. Two big problems with this is that most of these models have not been evaluated for their predictive performance, and most of them would require a significant investment of time to hand code and update measures they rely on, if it is possible at all.
Some area experts with a more in-depth knowledge of a region or particular country may point out that a high or low risk forecast for a country is “obvious”. If such comments are made in retrospect, after outcomes are already observed, we should view them with some hesitation. It is true, though, that these experts can add much more to our understanding of the events in a particular country than our models can. But a problem with that is that there are experts for many countries who may point to worrying trends, and it might be difficult to weigh which set of experts should receive more attention. Forecasts like ours provide a principled way of doing that, and also of weighing the evolution of risk within a single country over time.
Another important point to keep in mind for those who don’t find these quantitative forecasts appealing is to ask what the alternatives are. We know from research on decision making that many experts predict quite poorly once you hold them accountable for making and evaluating specific forecasts, and that even simple statistical models can outperform most forecasters. We have specific forecasts over a specific time period, and it will be relatively easy to see how well we did in about 11 months, when the year ends.
It is difficult to predict the accuracy of any forecast. There are many obstacles to doing so with the approach we have taken, from overfitting to accidental contamination of variables with future information to changes in test and live forecasting procedures to inappropriate use of a test set for guiding modeling decisions (2nd order overfitting), and others. At the end of the day, we will have to, and plan to, see how well these forecasts did.
Powell & Thyne, 2011, Global instances of coups from 1950 to 2010: A new dataset.↩︎
Powell & Thyne classify the Euromaidan events in Ukraine in 2014 as a coup. Writing about this in the context of irregular leadership changes, which include coups but also revolutions in the sense of successful mass protest campaigns, Ukraine appears to us more like the latter. It also bothers me that calling the Ukraine events a “coup” plays into the Russian propaganda that attempts to portray the current Ukrainian regime as the result of a neo-fascist coup.↩︎
Another possibility is to model coup attempts using the full data and then in a second stage model to model coup success or failure using the data for the ~300 coups in the data. This seems to be the approach taken in published research on coups that tries to model attempts in addition to successful coups. One problem is that 300 cases don’t leave much room for robust modeling with cross-validation and a separate test set.↩︎
It’s possible to get compatible sets of the full CV predictions for all folds and repetitions by setting up the partitioning scheme in
caretto use the same random seeds/partitions for all 4 models (lasso + random forest for coup + failed attempt). On the todo list for next year.↩︎Naunihal Singh describes several of Ghana’s coups in the late 60s and 70s in his book Seizing Power.↩︎
If it is the case that quite a few coups lead to subsequent elections, including such a counter would problably work great in our observed data. The problem is that we don’t know about future elections scheduled as a result of furture coups yet, so doing this would also inflate our sense of the accuracy of the real forecasts.↩︎